Financial analysis, planning, and decision-making are primarily based on financial statements. These statements mainly consist of the Balance Sheet and the Profit and Loss Account. The Profit and Loss Account shows the operating activities of a concern over a period of time, while the Balance Sheet depicts the balance value of acquired assets and liabilities, representing the financial position of an organization at a specific point in time.
However, these statements alone may not disclose all necessary and relevant information. Therefore, to obtain material and relevant information needed to ascertain an enterprise’s financial strengths and weaknesses, it’s necessary to analyse the data presented in the financial statements.
Meaning and Concept of Financial Analysis
Financial analysis means the proper arrangement of financial data and methodical classification of the data given in the financial statement. It involves regrouping data into distinct components, dividing facts based on definite plans, classifying them based on certain conditions, and presenting them in a convenient, simple, and understandable form. It is described as an art involving various processes such as arrangement, analysis, setting up relationships between available facts, and drawing conclusions. According to AICPA, financial statements themselves reflect a combination of recorded facts, accounting principles, and personal judgments.
Meaning and Concept of Interpretation
The figures presented in financial statements are not helpful unless simplified. Interpretation means explaining the meaning and significance of the data that has been simplified through analysis. It involves comparing and examining components to make conclusions about a business’s profitability, efficiency, and liquidity position. The significance of financial statements lies not just in their preparation but in their analysis and interpretation. The analysis and interpretation provide a comprehensive and intelligent presentation of information that helps interested parties make judgments and decisions. It is described as a technique for X-raying the financial position and progress of a company.
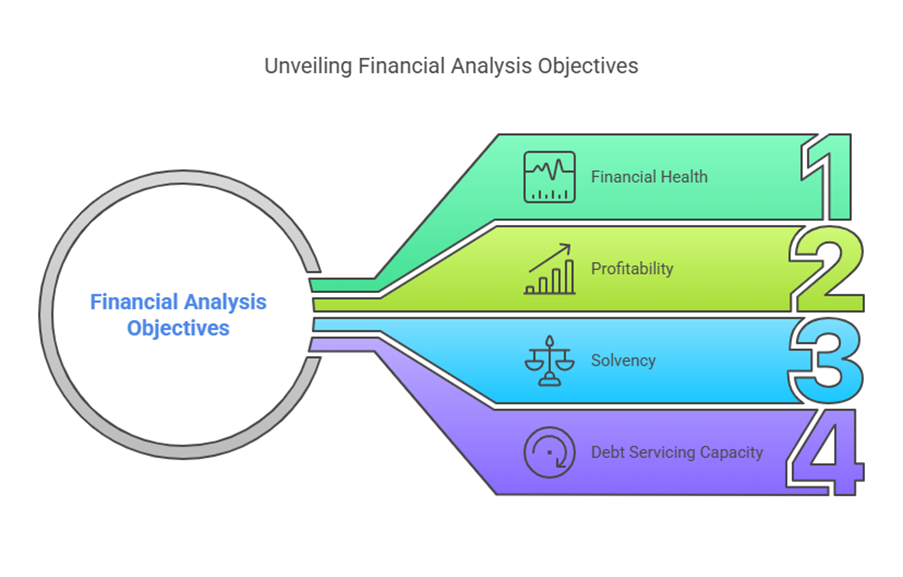
Objectives of Financial Analysis
The basic objectives of financial analysis are as follows:
- To examine the financial health of a firm.
- To evaluate the profitability of the enterprise.
- To understand the long-term and short-term solvency position of the firm.
- To study the debt servicing capacity of the firm.
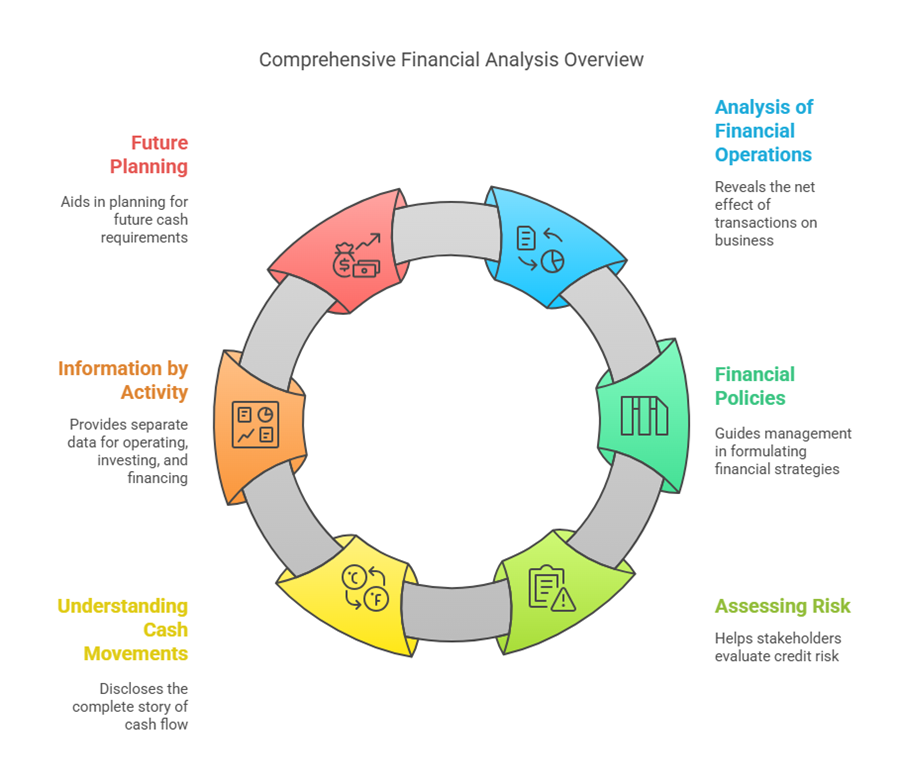
Importance and Benefits of Financial Analysis
Financial analysis and interpretation are useful tools in the financial manager’s analytical kit. They provide a summary of management decisions on financing activities and investment policy. The benefits include:
- Analysis of financial operations: Financial analysis, including tools like the Funds Flow Statement, reveals the net effect of various transactions on the operational and financial position of the business. It determines the financial consequences of business operations and discloses the causes for changes in assets and liabilities between different points in time. It also highlights the effect of these changes on the liquidity position.
- Financial policies: Analysis can guide management in formulating financial policies, such as those related to dividends and reserves.
- Assessing the degree of risk: Analysis helps stakeholders like bankers, creditors, and financial institutions assess the degree of risk involved in granting credit.
- Understanding Cash Movements: Tools like the Cash Flow Statement disclose the complete story of cash movement, including the reason for increases or decreases in cash.
- Information by Activity: The Cash Flow Statement provides information separately for operating, investing, and financing activities.
- Future Planning: By providing information on the sources and utilization of cash, the Cash Flow Statement helps management plan for future cash requirements, such as redeeming long-term liabilities or replacing fixed assets.
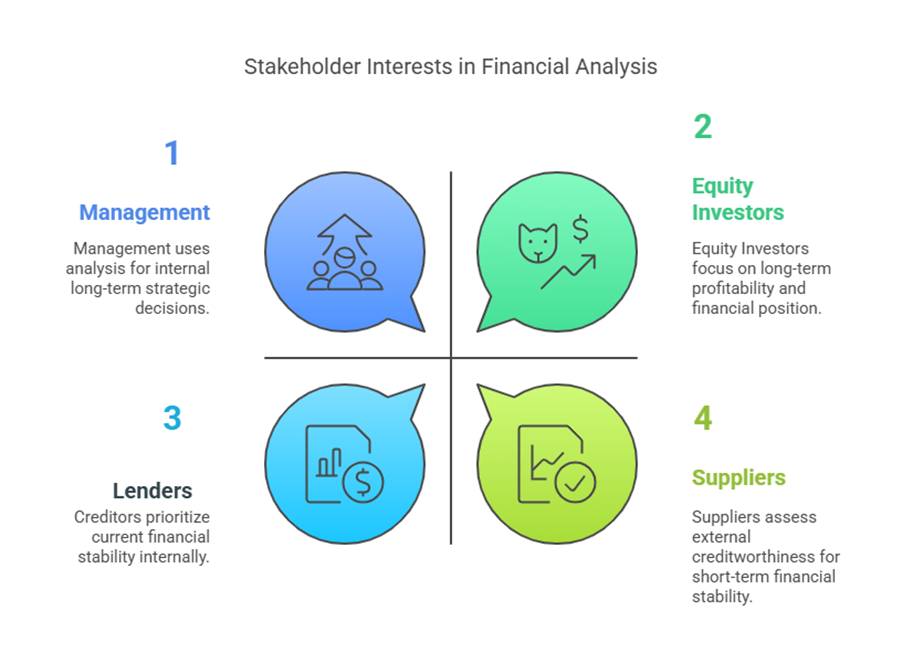
Users of Financial Analysis
Financial analysis is conducted by various parties with different perspectives. The users of financial analysis include:
- Management: They use analysis to understand the financial strengths and weaknesses of the enterprise and for internal decision-making.
- Equity Investors: Interested in evaluating the profitability and financial position.
- Lenders:
- Long-term Creditors: Concerned with the long-term solvency and debt servicing capacity.
- Short-term Creditors: Interested in the current financial stability and solvency.
- Suppliers: Interested in the financial position, likely for creditworthiness.
- Analysts: Can study economic power concentration, analyse financial policies, and opine on investment patterns.
- Labour Union: Can understand income and expenditure to bargain for fair wages and benefits.
- Legislation: Can obtain information for licensing, price fixing, and other regulations.
Types of Financial Analysis
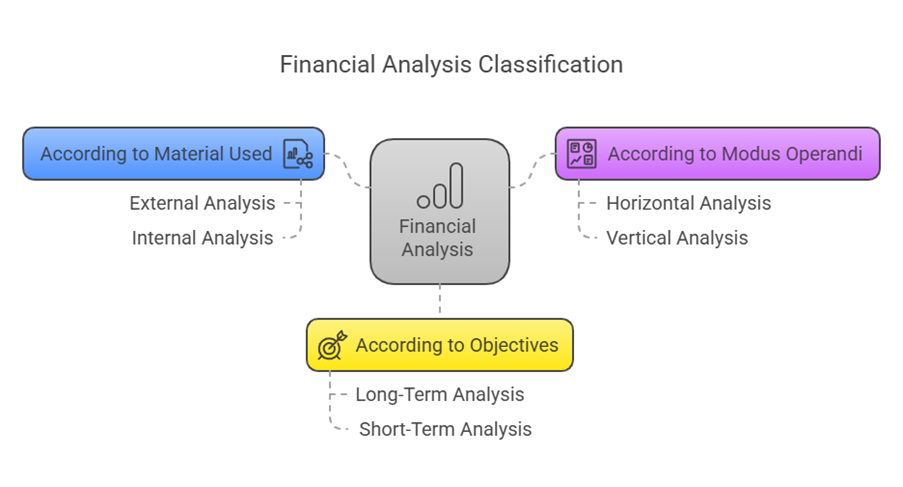
Financial analysis can be classified based on different criteria:
- According to Material Used:
- External Analysis: Conducted by external persons not directly related to the concern’s accounting records. They depend on published financial statements and other supplementary information in annual reports to get an idea and make decisions. This is typically done by banks, money lenders, creditors, government agencies, prospective investors, etc.
- Internal Analysis: Conducted by internal persons related to the accounting records, using internal records and books. This is done by members of the concern like finance and accounting staff or executives to help management assess profitability, solvency, liquidity, and identify reasons for weakness.
- According to Modus Operandi (Method of Operation):
- Horizontal Analysis: Compares and interprets financial statements of one year with those of another year or years. It can be based on ratios derived from financial information over the same time span. Also referred to as Trend Analysis.
- Vertical Analysis: Analyses the financial statement of an organization for a single period. This analysis is useful for inter-firm comparison. Also referred to as Common-Size Financial Statements Analysis.
- According to Objectives:
- Long-Term Analysis: Studies long-term financial stability, solvency, and profitability. It helps determine if the firm will survive in the long run and assists in long-term financial planning.
- Short-Term Analysis: Studies current financial stability, solvency, and profitability. It helps determine if the firm has sufficient funds to meet its short-term requirements and assists in working capital analysis.
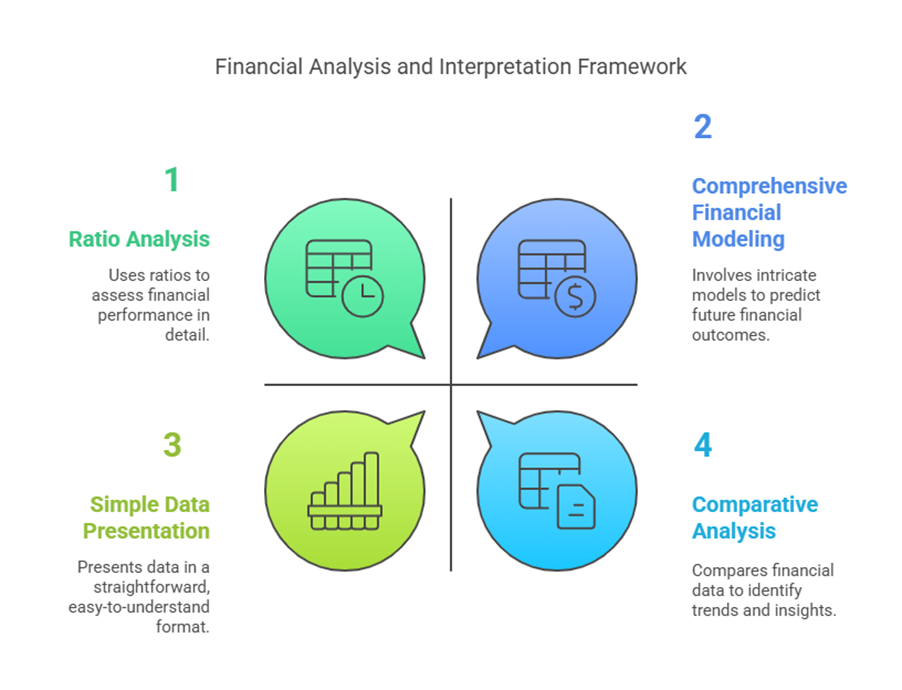
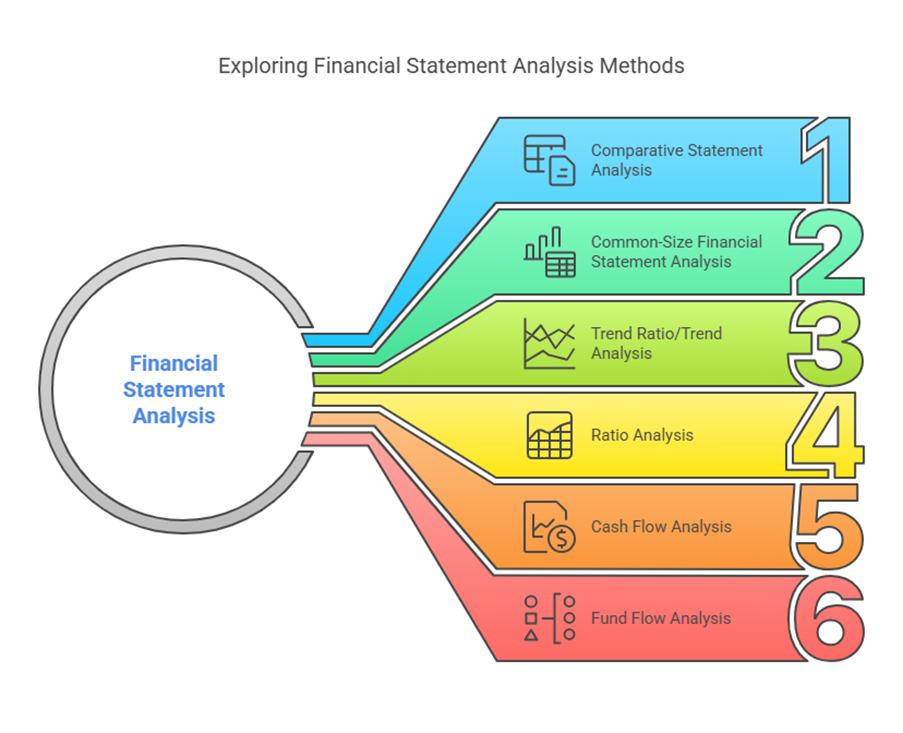
Tools of Financial Analysis
The important methods or tools used in financial statement analysis are:
- Comparative Statement Analysis
- Common-Size Financial Statement Analysis
- Trend Ratio/Trend Analysis
- Ratio Analysis
- Cash Flow Analysis
- Fund Flow Analysis
While a single year’s statement analysis isn’t very useful, comparative, common-size, and trend analysis are necessary.
Ratio Analysis
Ratio analysis is the process of determining and interpreting numerical relationships based on financial statements. A ratio is a statistical yardstick that measures the relationship between variables or figures, expressed as a percentage or a quotient. Financial ratios provide clues but not conclusions, and are tools for experts, as there is no standard ready-made interpretation. Ratio analysis is a tool used in financial analysis and planning.
Types of Ratios: Financial ratios are typically grouped into four categories:
- Liquidity Ratios / Short-term Solvency Ratios: Measure a firm’s ability to meet its short-term obligations. Examples include Current Ratio and Acid-test ratio (Quick Assets / Current Liabilities).
- Leverage Ratios / Long-term Solvency Ratios: Measure the proportion of debt in a company’s capital structure and its ability to meet long-term obligations. Examples include Debt-Equity Ratio, Debt Service Coverage Ratio, and Capital gearing ratio. The Debt-Equity Ratio ascertains the proportion between outsiders’ funds (total long-term debt) and shareholders’ funds.
- Activity Ratios / Efficiency Ratios / Performance Ratios / Turnover Ratios: Measure how efficiently a firm uses its assets. Examples include Inventory turnover ratio, Trade Receivables turnover ratio (Debtors’ turnover ratio), Trade payables turnover ratio, and Net capital turnover ratio.
- Profitability Ratios: Measure a company’s ability to generate income. Examples include Net profit ratio, Return on Capital employed, and Return on investment.
Certain ratios are required to be disclosed in the notes to accounts when preparing Financial Statements, including Current Ratio, Debt-Equity Ratio, Debt Service Coverage Ratio, Return on Equity Ratio, Inventory turnover ratio, Trade Receivables turnover ratio, Trade payables turnover ratio, Net capital turnover ratio, Net profit ratio, Return on Capital employed, and Return on investment.
Applications of Ratio Analysis: Ratio analysis is applied in financial decision-making and for evaluating performance.
Limitations of Ratio Analysis: Financial ratios provide clues but not conclusions. There is no standard interpretation. Other limitations are mentioned in the sources but not detailed.
Funds Flow Analysis
The Balance Sheet gives a static view and doesn’t show the movement of funds. Funds Flow Statement (FFS), also known as Statement of Changes in Financial Position, Statement of Sources and Application of Funds, or Where Got, Where Gone Statement, explains how funds moved during a period. It reveals the causes of changes in assets, liabilities, and owners’ equity between two balance sheet dates.
Meaning of Funds: The term “Funds” has various meanings:
- Narrow sense: Only cash (basis for Cash Flow Statement).
- Broader sense: All financial resources (men, materials, money, machinery).
- Popular sense: Working Capital (excess of Current Assets over Current Liabilities). If funds mean working capital, the statement is called Funds Flow Statement.
The FFS provides information about the enterprise’s investing and financing activities, classifying them as Sources (generate funds) and Uses or Applications (involve spending funds). It offers a detailed analysis of changes in resource distribution between two balance sheet dates.
Significance of Funds Flow Statement: FFS is a useful analytical tool for financial managers. It summarizes management decisions on financing activities and investment policy. It reveals the net effect of transactions on operational and financial position, determines financial consequences, discloses causes for changes in assets/liabilities, and highlights the effect on liquidity. It guides management in formulating financial policies and helps external parties assess credit risk. FFS is useful in planning intermediate and long-term financing and deals with all components of working capital. It reveals sources and application of funds, with the difference representing the net increase or decrease in working capital.
Sources and Application of Funds: Sources include funds from operations, issue of shares, long-term borrowings, sale of fixed assets, sale of investments, etc. Applications include purchase of fixed assets, purchase of investments, repayment of long-term borrowings, redemption of preference shares/debentures, dividend paid, tax paid, increase in working capital, etc.
Limitations of Funds Flow Statement: FFS indicates only past changes and cannot reveal continuous changes. Transactions where both aspects are current, or both are non-current are not considered. When prepared focusing on working capital changes, it shows whether working capital increased or decreased but doesn’t explain the reasons for this change.
Cash Flow Analysis
Cash Flow Statement (CFS) explains how cash and cash equivalents held by the business have changed between two balance sheet dates. It reveals the causes of changes in the cash position. According to Accounting Standard – 3 (Revised), an enterprise should prepare a Cash Flow Statement for each period with financial statements. AS-3 (Revised) also defines cash, cash equivalents, and cash flows.
- Cash: Includes cash on hand and demand deposits with banks.
- Cash Equivalents: Short-term, highly liquid investments that are readily convertible into cash.
Format of Cash Flow Statement: AS-3 (Revised) suggests classifying cash flows by operating, investing, and financing activities.
- Cash Flows from Operating Activities: Result from the main revenue-producing activities. Can be presented using the direct method (showing major classes of gross cash receipts and payments) or the indirect method (adjusting net profit for non-cash items). Includes cash receipts from customers, cash paid to suppliers and employees, income tax paid, cash generated from operations, etc. Extraordinary items should be classified appropriately and disclosed separately.
- Cash Flows from Investing Activities: Result from the acquisition and disposal of long-term assets and other investments not considered cash equivalents. Includes purchases and sales of fixed assets and investments.
- Cash Flows from Financing Activities: Result from changes in the size and composition of the owner’s capital and borrowings of the enterprise. Includes proceeds from issue of shares, long-term borrowings, repayments of long-term borrowings, interest paid, dividend paid, etc. The statement shows the net increase or decrease in cash and cash equivalents and the beginning and ending balances.
Advantages of Cash Flow Statement: CFS provides information about cash sources and uses. Advantages include:
- Discloses the complete story of cash movement and the reason for change.
- Provides information separately for operating, investing, and financing activities.
- Helps management plan for future cash requirements (e.g., for redeeming liabilities, replacing assets). CFS is more useful for short-term analysis and cash planning compared to Funds Flow Statement and deals only with cash and cash equivalents.
Limitations of Cash Flow Statement: Limitations exist, though not specified in detail in the provided texts.
Other Tools: Comparative, Common-Size, and Trend Analysis
Analysing based solely on a single year’s statement is often insufficient.
- Comparative Statements: Present financial figures for two or more periods side-by-side to show changes over time. This is the basis for Horizontal Analysis.
- Common-Size Statements: Present each item in a financial statement as a percentage of a base figure (e.g., total assets in the balance sheet or net sales in the income statement). This facilitates Vertical Analysis and comparison across different-sized companies or periods.
- Trend Analysis: Involves calculating ratios or percentage changes over several periods to identify trends. A trend line can be used based on time series data. This is essentially Horizontal Analysis over multiple years.
In summary, the analysis and interpretation of financial statements involve transforming raw financial data into meaningful information for various stakeholders. Key tools used include Ratio Analysis, Funds Flow Analysis, Cash Flow Analysis, and comparative, common-size, and trend analysis, each offering different insights into a company’s profitability, solvency, efficiency, and liquidity. While powerful, these tools have limitations and require expert interpretation.