Introduction to Data Analytics
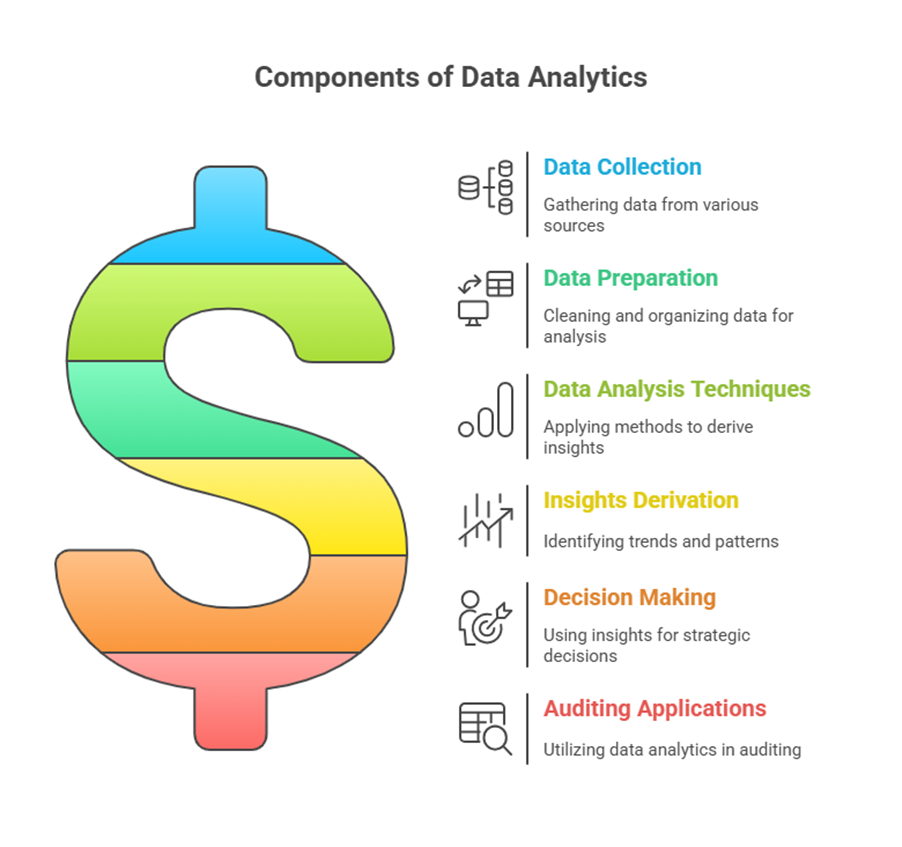
Data analytics is defined as the application of data science approaches to gain insights from data. It involves a series of steps starting with the collection of data, preparing that data, and then applying various data analytic techniques to derive relevant insights. These insights include, but are not limited to, trends, patterns, deviations, inconsistencies, and relationships among data elements identified through analysis, modelling, or visualization. Such insights are valuable for planning and conducting audits. Data science itself refers to an emerging area focused on the collection, preparation, analysis, visualization, management, and preservation of large information collections, requiring a mix of skills, including non-mathematical ones.
The purpose of data analytics is to provide a competitive advantage that enables information-based decision making. While still evolving, its potential uses are being explored in both public and private sectors. These guidelines specifically prescribe the methodology for employing data analytics within the auditing function of IA&AD, although the principles and methods are also applicable to accounting and administration. The guidelines represent a significant initiative to institutionalize the practice and use of data analytics within the department. They were developed as a follow-up to the Big Data Management Policy issued in September 2015 and subsequent initiatives, drawing upon existing guidelines and standards in areas like Performance Auditing, Compliance Auditing, Financial Auditing, and Auditing Standards.
As a Supreme Audit Institution, IA&AD needs to be agile to keep pace with technological advancements that produce volumes of data from diverse systems, presenting significant opportunities for data analytics. The formulation of the Big Data Management Policy in 2015 outlined the broad framework, and the creation of the Centre for Data Management and Analytics (CDMA) was the initial step in establishing this framework. These guidelines are intended to be useful for officers and staff in purposefully applying data analytics to enhance the quality of public accounting and auditing.
While these guidelines are prescriptive, they are not intended to override the professional judgment of the Accountant General (which includes Heads of Departments of Senior Administrative Grade and above). Accountants General are expected to make situation- or subject-specific adjustments but must document the rationale for significant departures and obtain authorization from the competent authority.
Data Analytics and IA&AD’s Audit Mandate
IA&AD has a broad audit mandate covering the Union and State Governments, statutory corporations, government companies, autonomous bodies, urban and local bodies, and any other entity entrusted to the Comptroller and Auditor General. Audits are conducted using accounts, vouchers, and records received, which may include online data, information, and documents from the audited entity. Auditing Standards require obtaining sufficient and appropriate evidence to support auditor judgment and conclusions. This involves studying and analyzing data collected before and during audits. Given limited resources, IA&AD uses a risk-based audit approach, applying analytical procedures, tests of controls, and substantive checks on available and selected data during planning and execution.
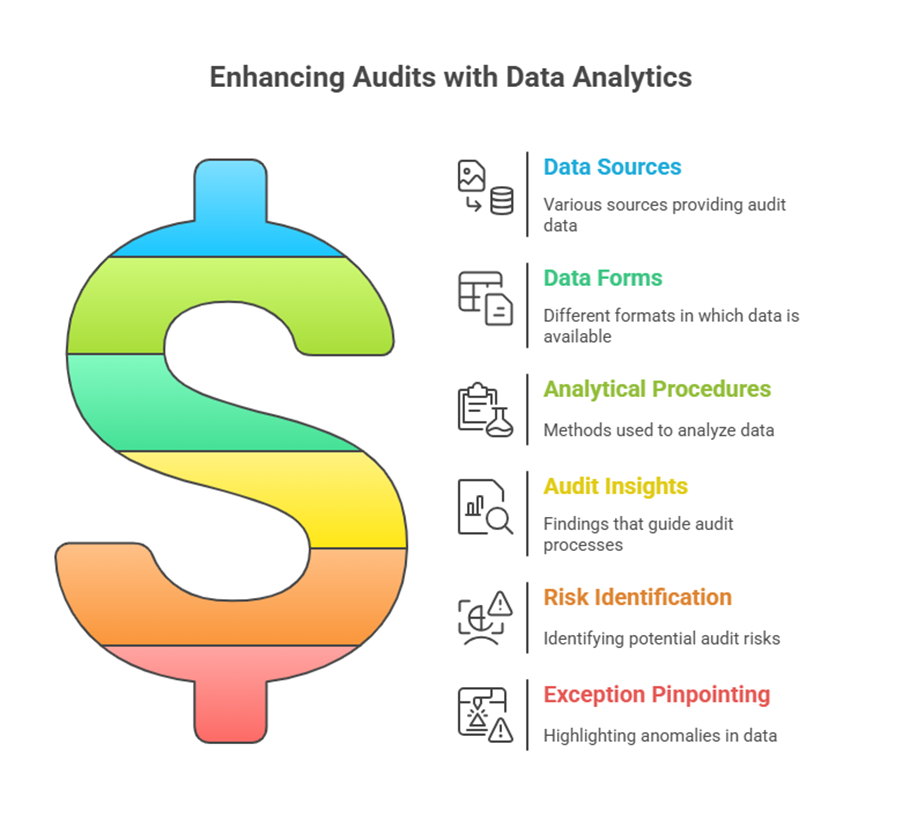
With increasing computerization, most activities of auditable entities are recorded electronically in IT systems. These electronic records, or ‘data’, if interpreted correctly, can provide insights into past events, guide present actions, and forecast future ones, thereby improving auditor efficiency. Data is available today from various sources and in different forms. Data analytics offers the potential to analyze these datasets and obtain insights that assist audit processes by identifying patterns, trends, descriptions, exceptions, inconsistencies, and relationships. The insights drawn can help in setting audit direction, primarily by identifying areas of interest or risk and pinpointing exceptions.
The Data Analytic Process
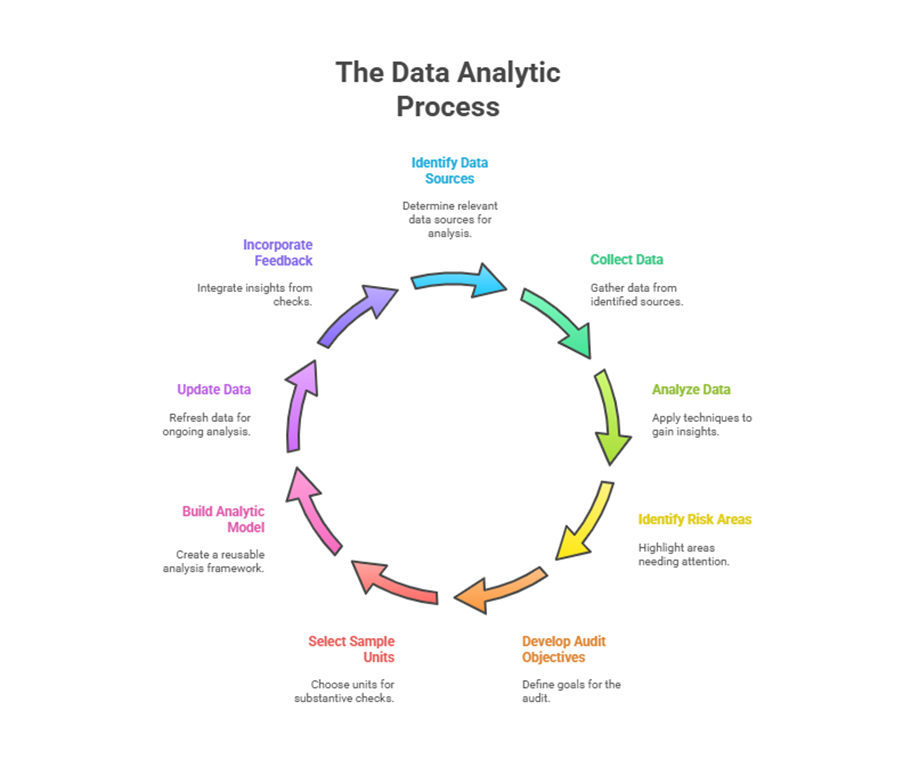
Data analytics begins with identifying and collecting various data sources for a specific audit. Analysis of this data using different techniques yields insights into the audited entity’s operations. Risk areas or areas of interest identified through this exercise help in identifying audit objectives and developing an Audit Design Matrix. Data analytics also aids in selecting the sample of audit units for substantive checks.
The analyses can be built into a re-executable Data Analytic Model. This allows repetitive use of analysis results with periodic data updates. Establishing a mechanism for periodic data receipt is crucial for this. The model’s scope can expand by incorporating feedback from substantive checks and including additional data sources. Thus, data analytics in IA&AD is envisioned as an evolving process, not a one-off exercise.
The overall data analytic process encompasses data acquisition, data preparation, data analysis, results, and analytic models.
Roles and Responsibilities
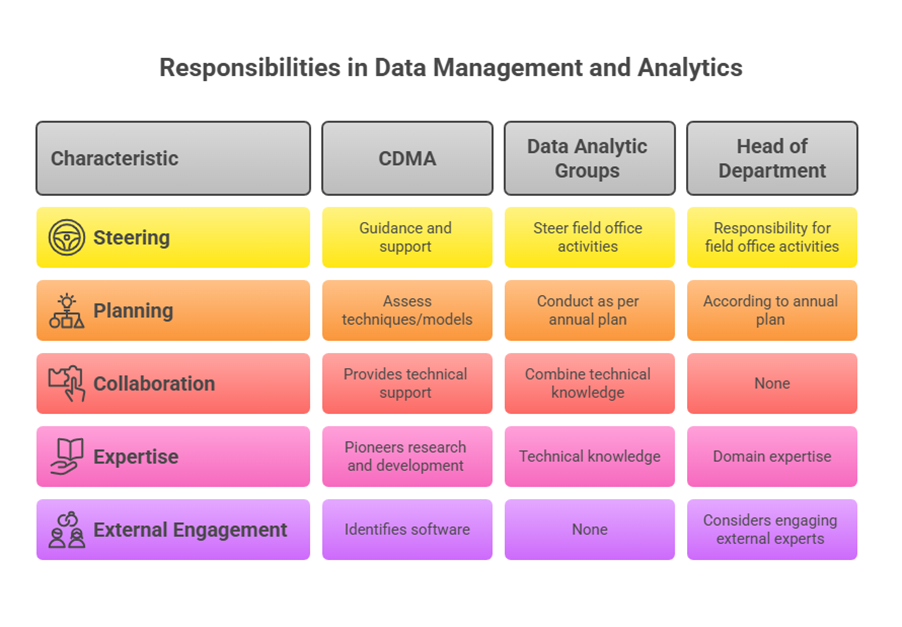
The Centre for Data Management and Analytics (CDMA) is the nodal body for steering data analytic activities in IA&AD. CDMA provides guidance to field offices, pioneers research and development, facilitates capacity building, collects central third-party data, identifies software, assesses techniques/models, and disseminates them. CDMA also provides technical support and vets and approves data analytic models in consultation with headquarters functional wings.
Data analytic activities in field offices are the responsibility of the Head of Department (HoD), conducted as per their annual plan. HoDs constitute Data Analytic Groups under a Group Officer to steer these activities. Data analytics is envisaged as a collaborative effort combining the technical knowledge of Data Analytic Groups with the domain expertise from functional groups to obtain meaningful audit insights.
In specialized areas, field offices can consider engaging external experts if justified, following IA&AD guidelines. Such specialization could include data handling, applying advanced techniques, or managing data repositories.
Data: Types and Sources
The core of data analytics is data, which can be measured, collected, analyzed, and visualized for meaningful interpretation.
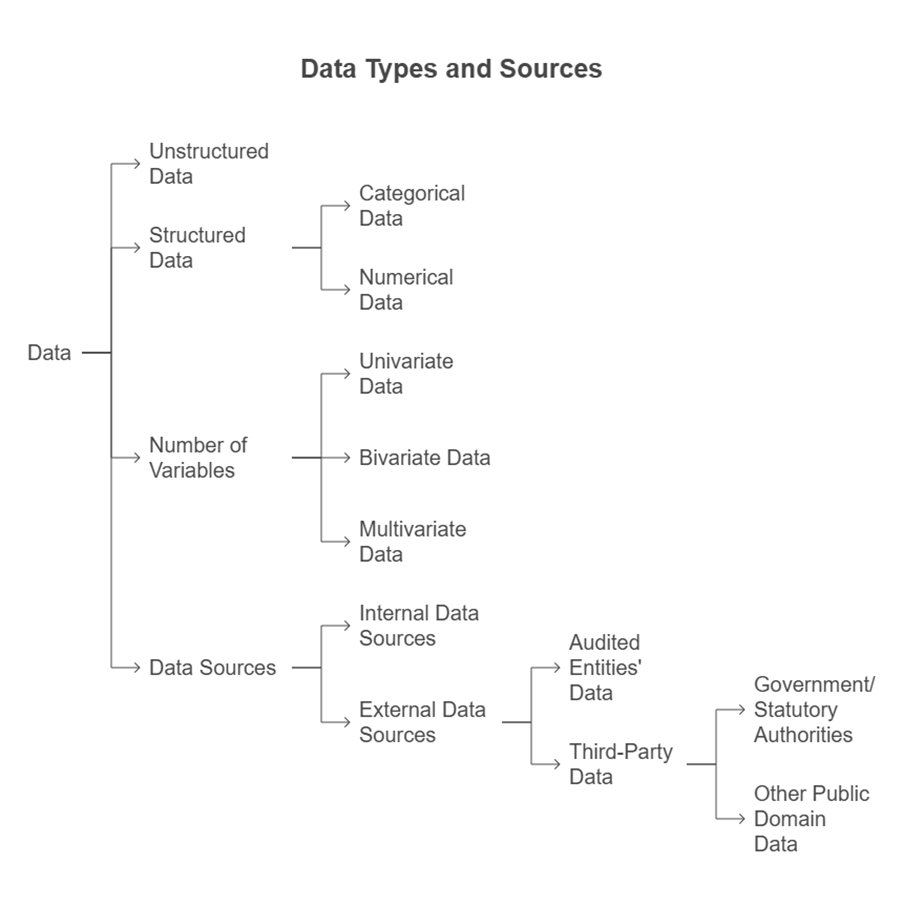
Data can be categorized based on structure and type:
- Unstructured data: Cannot be easily tabulated for analysis (e.g., text, image, audio, video).
- Structured data: In tabular form. This can be further categorized as:
- Categorical data: Not amenable to ordering (nominal, e.g., name, gender) or amenable to ordering (ordinal, e.g., ranking based on quality).
- Numerical data: Amenable to identifying differences (interval, e.g., temperature) or comparable as multiples (ratio, e.g., expenditure).
- Number of variables:
- Univariate data: One variable, descriptive in nature, involves summarization and pattern identification.
- Bivariate data: Two variables, statistical analysis for relationship understanding, visualized with scatter plots.
- Multivariate data: Multiple variables, statistical analysis for relationships and dependencies, can be visualized in multiple dimensions.
The Big Data Management Policy categorizes data sources available to IA&AD:
- Internal data sources: Data available within the department (e.g., Combined Finance and Revenue Accounts, GPF/Pension data, data from audit processes).
- External data sources:
- Audited entities’ data: Financial/non-financial data, programme-specific data (including beneficiary databases), and other entity data available with the department.
- Third-party data: Data available in the public domain. This includes:
- Data published by Government/statutory authorities (e.g., Census, NSSO, Ministry data, data.gov.in, commission reports).
- Other public domain data (e.g., NGO surveys, industry information from bodies like CII/FICCI/NASSCOM, sector-specific information, social media).
Field offices may also encounter required data in manual form, which can be converted into electronic datasets. For instance, details from sanction orders could be digitized. Field offices should establish mechanisms to identify and periodically update availability of electronic data from entities/third parties within their jurisdiction.
Data Acquisition and Handling
Data acquisition involves gaining access to and collecting data, considering ownership, security, and reliability. Data availability can be challenging as IA&AD doesn’t own many sources, and entities may be reluctant to share data. Continuous persuasion and monitoring, leveraging provisions of the CAG’s Act and Audit Regulations, are necessary.
Data can be provided through various access modes:
- Access to the entity’s system: Read-only access on-site.
- Backup files: Created and shared on removable media.
- Electronic transfer: Via networks like LAN, WAN, internet, or VPN.
- Online access: Through cloud or remote servers.
- Real-time systems: Access to live data, potentially enabling continuous auditing through embedded audit modules.
Auditors may move directly from manual records to real-time electronic access without intermediate steps. Access depends on auditor capability, the auditing environment, and the established access level.
Involving audit from the IT system design stage can help incorporate audit’s data requirements into system design, facilitating acquisition in the requisite format. Field offices should convey data requirements (information sets, format, mode, periodicity) for important system developments. However, audit involvement at this stage should not preclude accessing the complete system or data if needed for specific audits (performance, systems, IT, special audits).
Handling data shared via removable media requires compatible hardware (CD, DVD, tape drive, USB), operating system, and database application to read the data, potentially requiring recreating an environment similar to the source. Read-only rights on entity systems typically facilitate viewing/copying. Electronic transfer involves file transfer over networks. Field offices should strive to evolve periodic/real-time data access mechanisms into their data repository/analytic models.
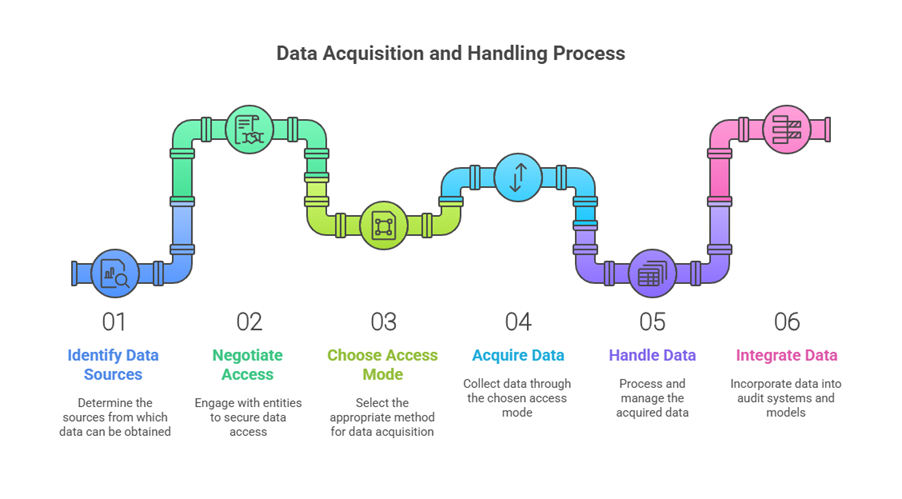
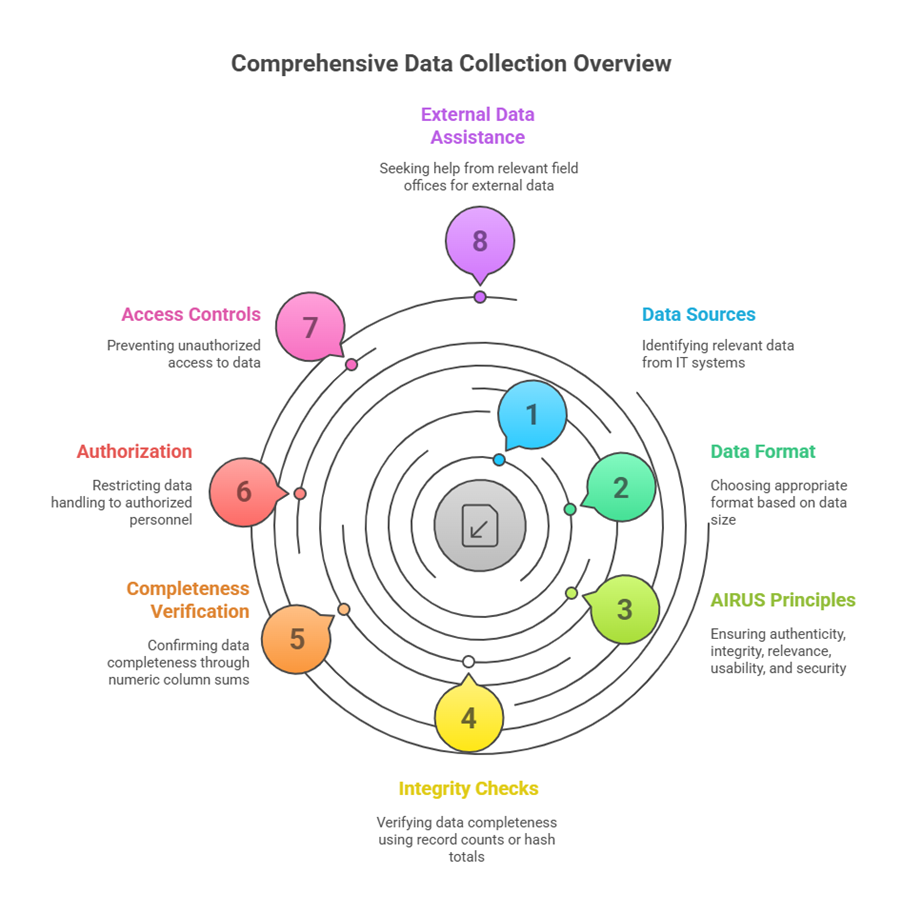
Data Collection is the systematic gathering and measurement of information from sources. Understanding the entity’s IT system helps identify relevant data. This can include complete databases, selected parts, or data meeting specific criteria. Data size dictates format (flat file or dump file).
Crucially, when collecting data, authenticity, integrity, relevance, usability, and security (AIRUS) must be ensured. Integrity (data completeness) can be checked using record counts or hash totals. Completeness can be verified by summing numeric columns or comparing totals (e.g., taxes collected). Auditors should obtain a certificate from the entity confirming the data’s completeness and identity with the source system. Only authorized personnel should handle data transfers, and access controls should prevent unauthorized access.
For data from entities outside a field office’s audit jurisdiction, assistance can be sought from the relevant field office.
Data Ownership and Security
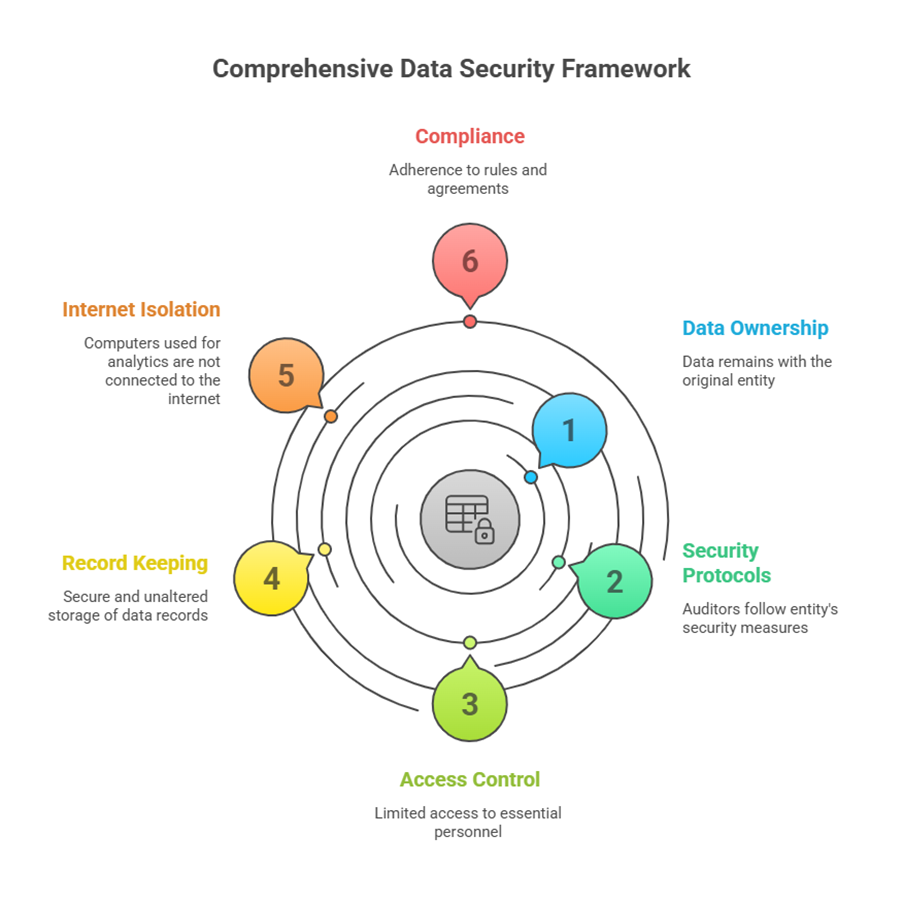
Ownership of data remains with the audited entity or third-party sources; IA&AD holds the data only in a fiduciary capacity. Once obtained, HoDs assume ownership responsibility for security and confidentiality, exercising controls similar to the original owner. Concerns and instructions from data owners must be considered. Data must be kept in safe custody, and analysis should be done only on copies. Compliance with rules, procedures, and agreements regarding data security, confidentiality, and use, within IA&AD’s framework, is mandatory.
Electronic records are easily copied, modified, or deleted. Auditors should follow security protocols applicable to the audited entity. Analytics results are handled as prescribed by IA&AD. The basic approach is to limit raw data access to essential personnel and maintain an access trail. Complete, chronological records of data shared must be stored securely and unaltered. Computers used for data analytics should not be connected to the internet. Due diligence is required to prevent unauthorized disclosure of sensitive data. Government information security measures, IA&AD’s Information Systems Security Handbook, and specific agreements should be followed.
Data Reliability
Data is reliable if it accurately captures the parameter it represents. Reliability is a function of authenticity, integrity, relevance, and usability. Generation/capture methods can affect reliability. Since IA&AD relies on external sources, understanding each source’s reliability a priori is vital for exercising caution.
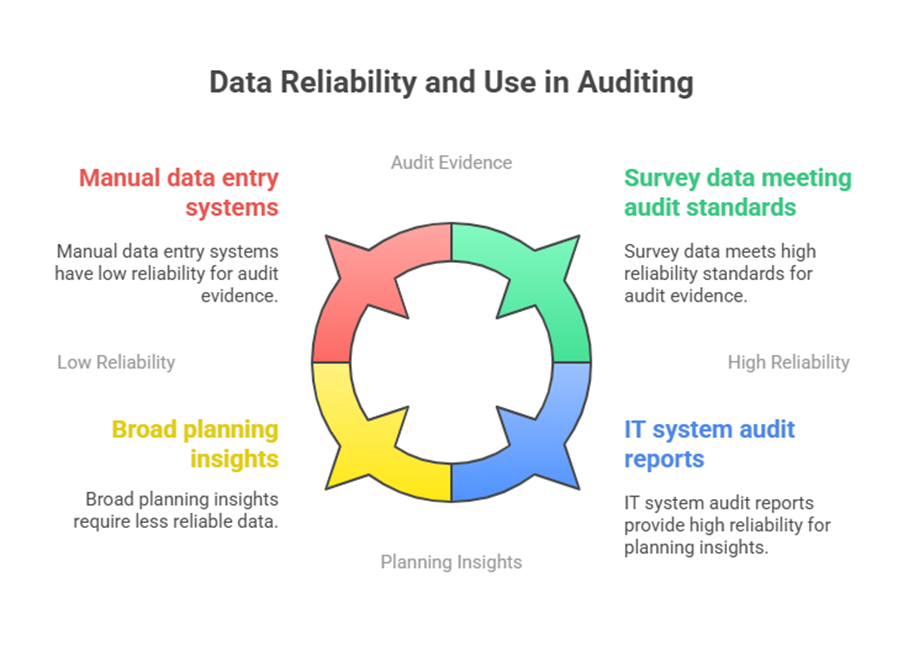
Auditors often have limited means to ensure reliability upon receipt, as assessment is often possible only during the audit process when analysis might reveal inconsistencies or incompleteness. Vigilance and precaution are necessary. Reliability is generally lower if manual and IT systems run in parallel or if an MIS system involves manual data entry. Information System audit reports on the IT system can offer insights into data reliability.
The required level of data reliability depends on its planned use. Reliability is significantly higher for data used as audit evidence supporting conclusions compared to data used for drawing broad insights during planning. While third-party data can enhance planning, professional judgment and adherence to CAG’s auditing standards criteria are needed if using such data as audit evidence. For example, survey data might identify issues for sampling but its use as evidence depends on whether it meets audit evidence standards.
Data Preparation
Identified datasets are often not in the desired form, size, or quality for analysis. Data preparation is the process of organizing data for analytic purposes by transforming it from the available format to the desired one. Understanding the data is a prerequisite for deciding the desired format.
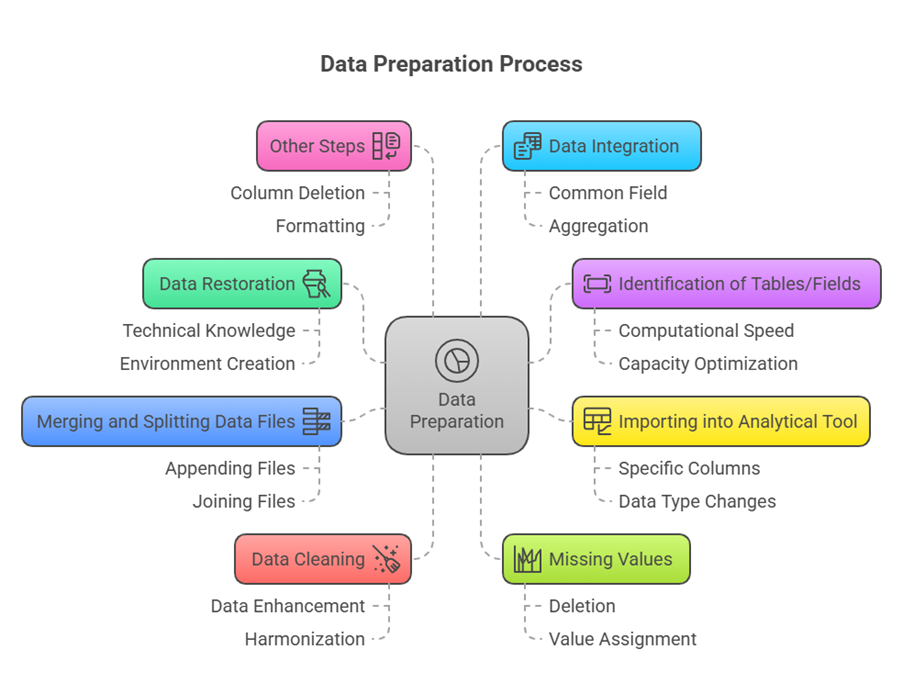
Data preparation involves various activities, which can be interconnected or independent steps, and may require backtracking or repetition:
- Data Restoration: Copying data from the source and restoring it, especially dump/backup files, to the auditor’s computer for analysis. Requires technical knowledge of the database and potentially creating a specific environment.
- Identification of tables/fields of interest: Selecting only relevant variables to optimize computational speed and capacity. Care must be taken, as missing relevant fields later means repeating steps.
- Importing into the analytical tool: Reading data files or connecting to databases using analytical software. Tools often offer options to import specific columns, change data types, and clean/enhance data.
- Merging and splitting data files: Combining datasets from different periods/locations or splitting large files to make them leaner for efficient analysis. This can be done by appending files (same structure, different data) or joining files (different structures, related by a common field).
- Data Cleaning (Cleansing/Scrubbing): Detecting and correcting or removing corrupt/inaccurate records. Involves identifying incomplete, incorrect, inaccurate, or irrelevant parts and replacing, modifying, or filtering them. Includes removing errors (e.g., typos), validating values, rejecting/correcting records, and verifying invalid values.
- Data Enhancement: A cleaning process to make data more complete by adding related information (e.g., adding Bank name to Bank Code) or through harmonization (e.g., short codes to full words) and standardization (changing reference data to a new standard code).
- Missing values: Handling instances where data values are absent. Missing values reduce dataset representativeness and can distort inferences. Understanding reasons/nature is important for appropriate treatment, such as deletion or assigning values like mean, median, or mode.
- Other steps: Deleting unwanted columns, formatting and renaming columns, and inserting new columns (e.g., a ‘YEAR’ column).
- Data Integration: Combining data from various sources or different tables within the same source to get the final dataset for analysis. Data can be integrated based on a common field (e.g., customer ID, bill number). If no common field exists, data can be aggregated at a higher level for comparison (e.g., comparing pension and BPL data aggregated by village/district). Understanding metadata aids integration.
Data preparation is project-specific; the steps and order may vary, but the broad activities are similar.
Data Analysis and Modelling
Once data is prepared, it is analyzed using various analytic approaches to derive insights.
Data Analytic Approaches:
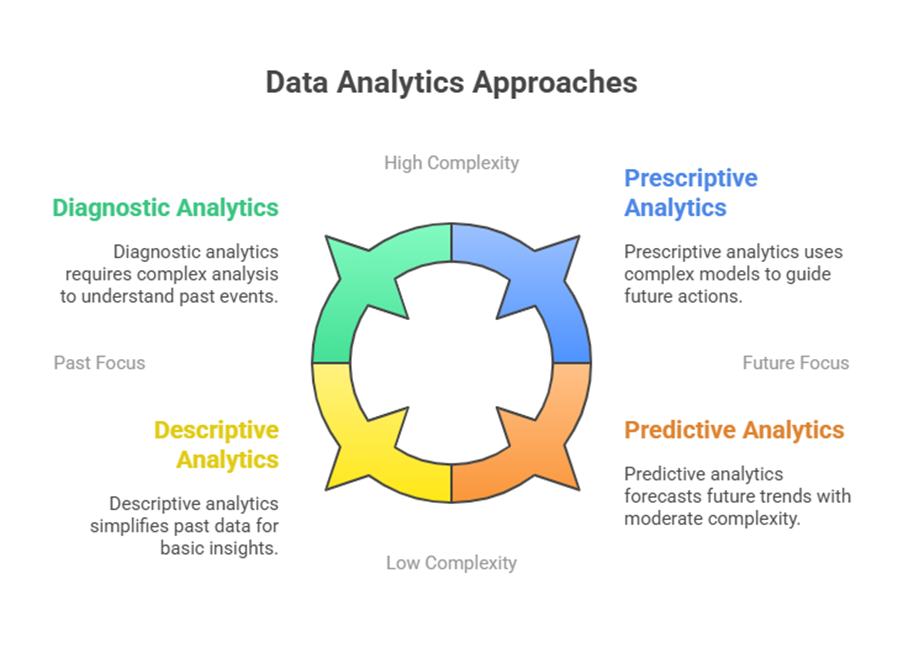
- Descriptive analytics: Answers “what has happened”. Summarizes raw data for user understanding, provides insights into past transactions, involves aggregation, numerical or visual descriptions.
- Diagnostic analytics: Answers “why did it happen” or “how did it happen”. An advanced form of descriptive analytics, involves understanding relationships between datasets and identifying specific transactions/reasons. Uses drill down and statistical techniques like correlation.
- Predictive analytics: Tries to predict “What will happen”, “when will it happen”, “where will it happen” based on past data. Uses forecasting and estimation techniques.
- Prescriptive analytics: Takes over from predictive analytics; allows prescribing actions (“inputs”) to alter future outcomes (“outputs”) towards a desired solution. Identifies multiple future scenarios based on different interventions.
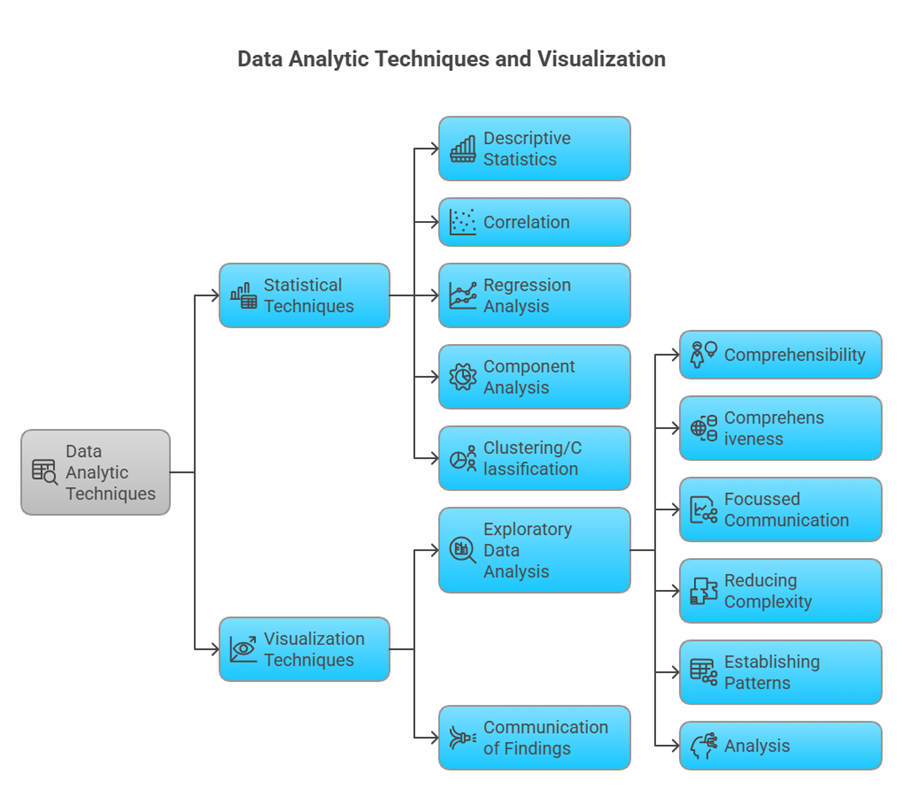
Data Analytic Techniques: Employed to leverage the above approaches. They can be broadly classified as Statistical and Visual.
- Statistical techniques: Use statistical measures to gain insights (e.g., correlation, regression).
- Visualisation techniques: Use visuals, graphs, and charts. While often statistical, understanding is derived visually.
A combination of techniques is usually employed. There is no rigid sequence for applying techniques, but a general approach is “zoom out – zoom in – filter”. First, understand data broadly (zoom out), then drill down for deeper understanding (zoom in), and finally filter/query to extract results or exceptions.
Specific statistical techniques include:
- Descriptive statistics: Summarize data (measures of central tendency, spread).
- Correlation: Measures strength of association between two variables (ranges -1 to +1).
- Regression analysis: Explains how variables relate numerically, enables predicting a dependent variable based on independent variable(s).
- Component analysis (Principal Component Analysis) / Factor analysis: Reduce/summarize correlated variables.
- Clustering / Classification: Group individuals/variables or arrange data into homogeneous groups based on common characteristics.
Results from different statistical tests should be interpreted collectively.
Data Visualization: Serves two distinct purposes:
- Exploratory Data Analysis (EDA): Analyzing data to summarize characteristics, often visually, to see what data reveals beyond statistics.
- Communication of findings/reporting: Powerfully communicating analytic insights to users/readers.
Objectives of data visualization include:
- Comprehensibility: Making information understandable.
- Comprehensiveness: Presenting features for the entire dataset/sample.
- Focussed communication: Concise and direct.
- Reducing complexity: Simplifying large data presentation.
- Establishing patterns and relationships.
- Analysis: Promoting focus on substance rather than methodology. Specific guidance is available in the IA&AD Practitioner’s Guide.
Modern tools allow analyzing the whole dataset, potentially making inferences about the population without solely relying on samples. However, substantive checks are still needed if the dataset doesn’t fully represent the business process.
Many open source and proprietary data analytic tools are available. No single tool is comprehensive; some are strong in preparation, others in visualization or advanced statistics. When adopting a new tool, considerations include sustainability (financial/human resources), scalability, future availability, and critically, data security, ensuring sensitive data isn’t shared unauthorized. Approval from CDMA may be required.
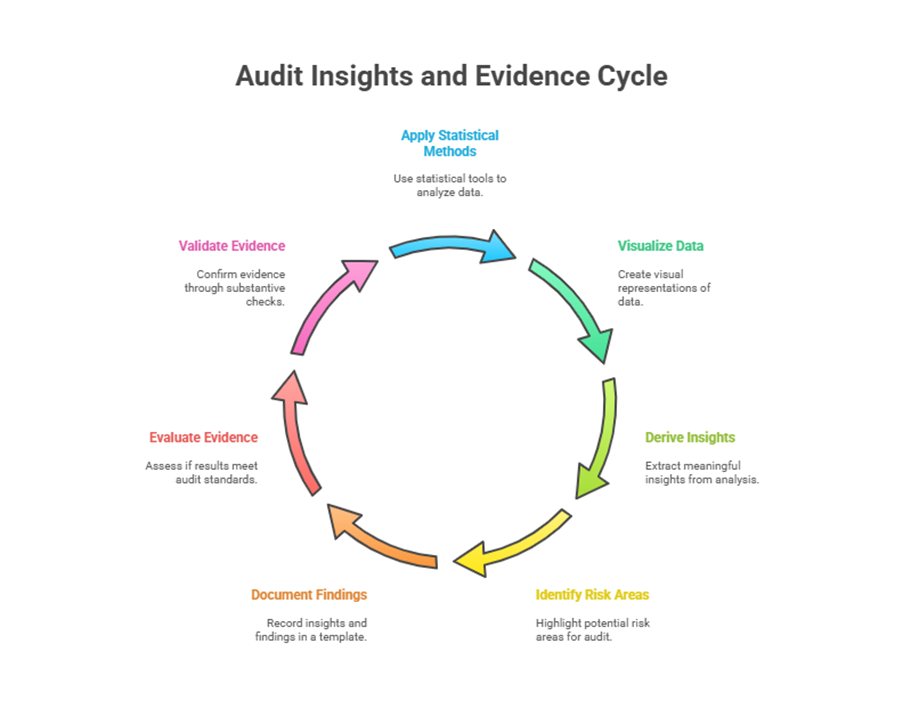
Data Analytic Results: Can take the form of Audit Insights or Audit Evidence.
- Audit Insights: Derived iteratively from applying statistical and visualization methods. Not all statistical findings are new insights; they should be appreciated collectively. Domain knowledge is essential to value and understand findings. Insights help identify risk areas/areas of interest for audit. A template exists for documenting findings and insights. Analytic findings (discovered through analysis, leading to insights) are different from audit findings (confirmed through substantive checks).
- Audit Evidence: Auditor professional judgment is used to evaluate if analytic results qualify as audit evidence. They may need validation by other evidence gathered through substantive checks. Results qualify as audit evidence when meeting Auditing Standards requirements (sufficient and appropriate, i.e., relevant, valid, reliable).
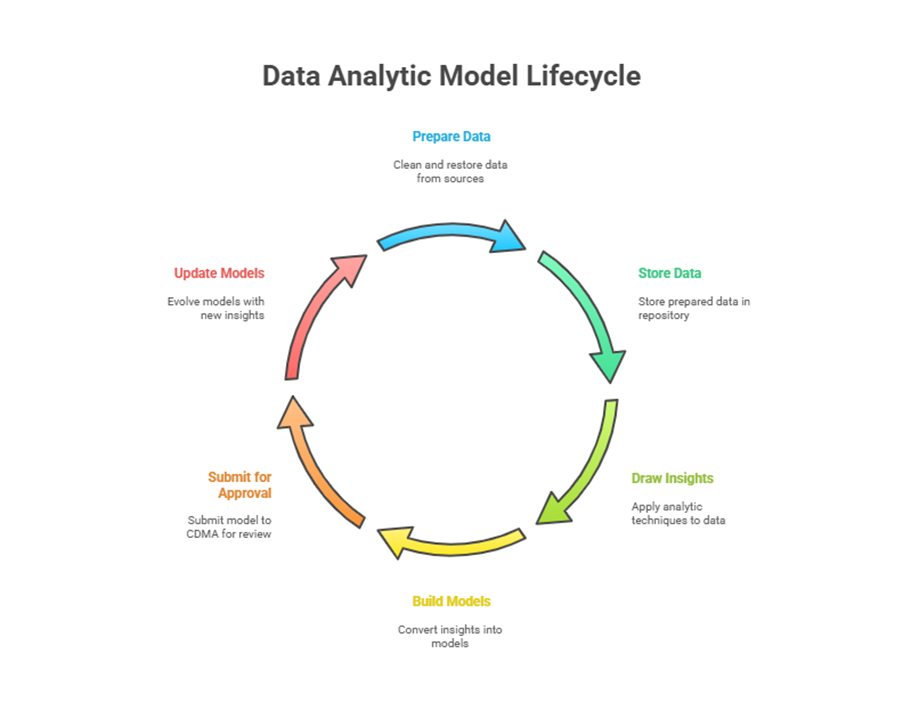
Data Analytic Models: A set of analytic tests leading to results that can be used repetitively by updating data. Building models allows repeated risk analysis with periodic data updates.
Steps to build a model:
- Prepare data from sources through restoration and cleaning.
- Store prepared data in the data repository.
- Draw insights by applying analytic techniques on data from the repository or after preparation.
- Convert relevant insights into data analytic models (equations, queries, workflows, dashboards). A dashboard is often an interactive interface showcasing multiple insights visually.
- Submit the model to CDMA for review and approval.
Models can be built on centralized data (directly on restored database or extracted tables) or decentralized data (using the model locally with data from each subunit). With real-time data, the model can update in real time, potentially enabling continuous auditing.
Preliminary models may evolve; they need updating with additional insights and relatable datasets that become available. A key feature is reusability, depending on periodic data updates. A mechanism for annual/periodic data collection must be established, specifying datasets, format, mode, and nodal officers. Data security issues must be addressed, and senior-level endorsement from the audited entity helps ensure periodic data availability. It’s preferable to build models on extracted tables rather than directly on raw data dumps. Access to the model should be controlled based on user profile (need to know/use).
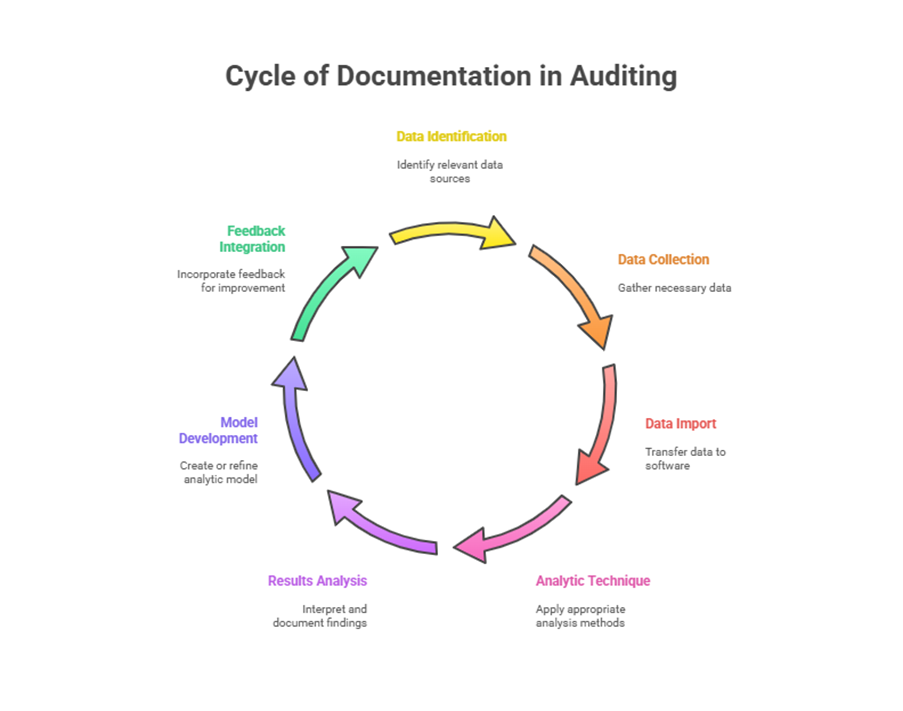
Documentation
Documentation of the analytic process is crucial for planning, performance, supervision, review, maintaining data integrity, providing an audit trail, supporting results, and enabling future teams to repeat the process. Documentation must follow IA&AD Auditing Standards and be signed by the auditor and countersigned by the supervisor.
Documentation should include:
- Data identification
- Data collection
- Importing data into analytic software
- Analytic technique used
- Results of analysis
- Data Analytic Model
- Feedback from use in audit
Data Repository
An evidence-based audit approach necessitates using various data sources. When risk analysis through data analytics becomes part of the audit process, data must be readily available. This requires a systematic data collection and management system leading to a Data Repository. Repositories are envisaged at both the central and field office levels.
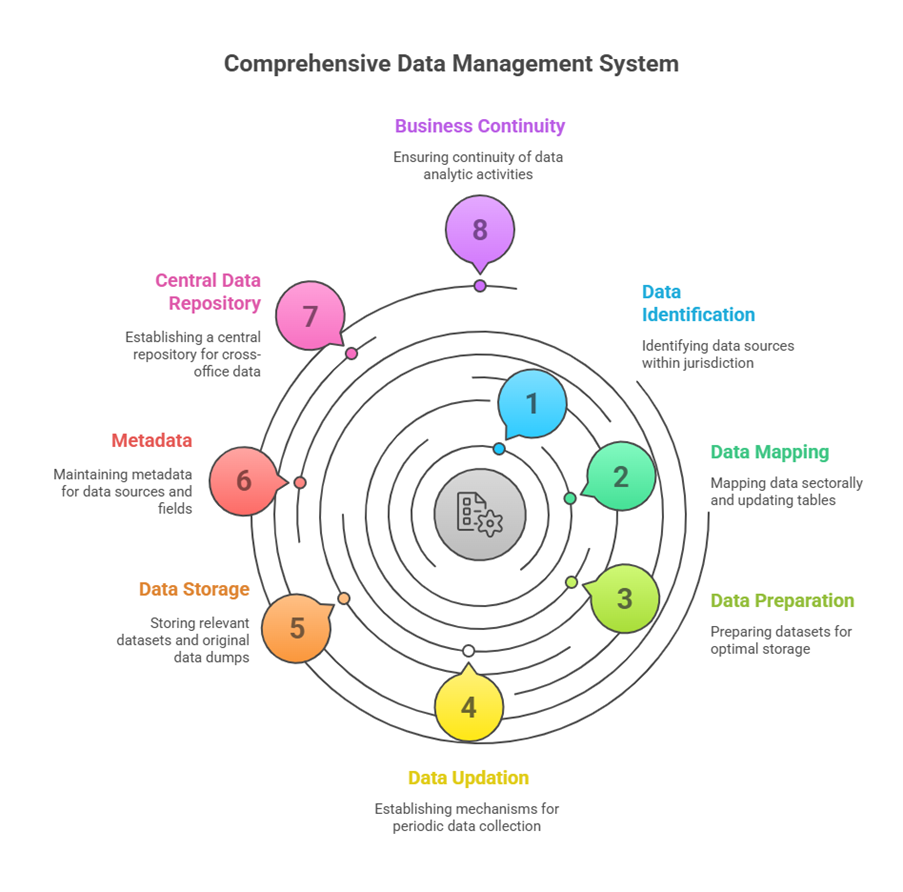
Field Office Data Repository: Field offices identify and collect data within their domain (internal, audited entities, third party). Building and maintaining the repository is a continuous process. Steps for creation/management:
- Data Identification: Continuously identify data sources (including third-party) within their jurisdiction.
- Data Mapping: Map data sectorally. Prepare a master table of data source utility across primary and other sectors. Update this table with knowledge gained from data analytics.
- Data Preparation: Prepare datasets before storing them to optimize storage.
- Data Updation: Establish a mechanism for periodic data collection, especially for datasets needed for analytic models.
- Data Storage: Store relevant extracted datasets in the repository and original data dumps systematically in external devices.
- Metadata: Maintain proper metadata for data sources, tables, and fields to facilitate identification and referencing. Data stored permanently for future reference; Data Analytic Groups are responsible.
Central Data Repository: CDMA establishes this for data applicable across multiple IA&AD offices. Field offices can access this data repository and selected central data analytic models based on defined rights and protocol.
Ensuring continuity of data analytic activities adheres to Business Continuity Management principles. Availability of data and analytic results/models is ensured through adequate cataloguing, version control, and security measures. Availability means data/systems are accessible and usable timely and as required.
Use of Data Analytics in Audit
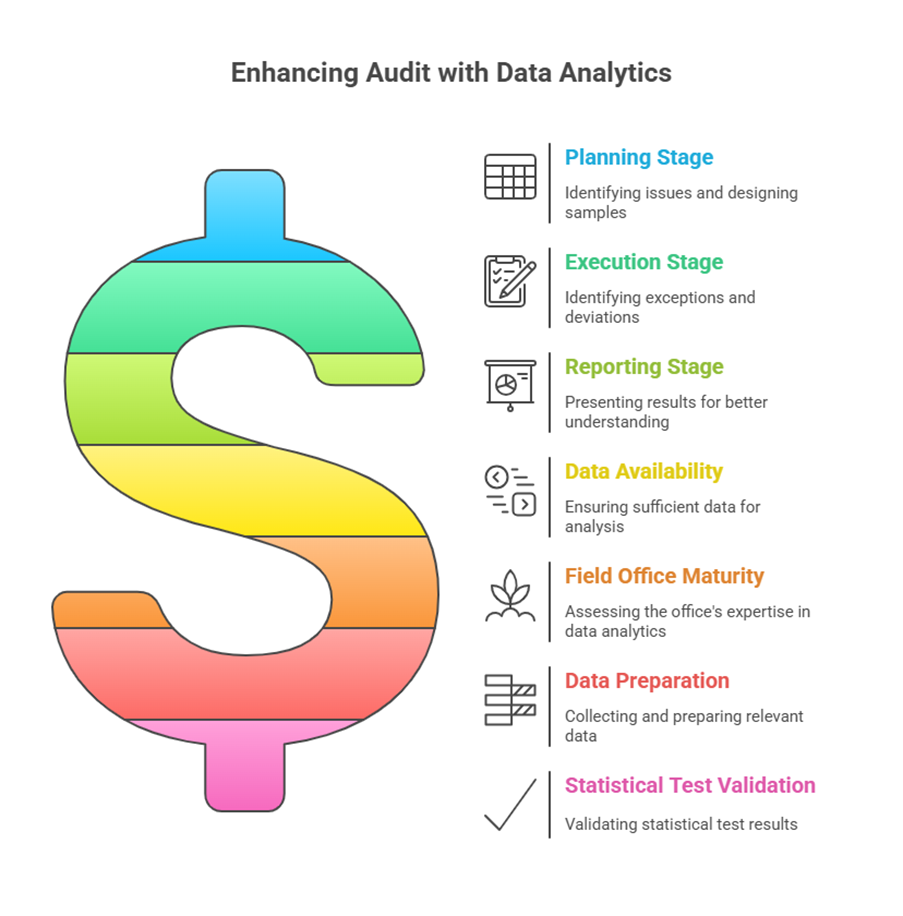
Data analytic results can be used at any stage of audit (planning, execution, reporting) to derive insights or evidence.
- Planning stage: Identify issues, unit planning, sample design.
- Execution stage: Identify exceptions, deviations, or describe conditions for use as audit evidence.
- Reporting stage: Present results from execution for better appreciation of findings.
Results used as audit evidence must meet Auditing Standards requirements for sufficiency and appropriateness (relevant, valid, reliable). The extent of use depends on data availability and the field office’s maturity in using techniques. The first step is identifying, collecting, and preparing relevant data. Linking and analyzing datasets provide utilities at various audit stages. Auditors should remain alert for new datasets during an audit and incorporate insights as practicable. Understanding assumptions/limitations of statistical tests is vital for valid interpretations; validation by a Nodal Statistical officer/Advisor may be needed if using test results for conclusions.
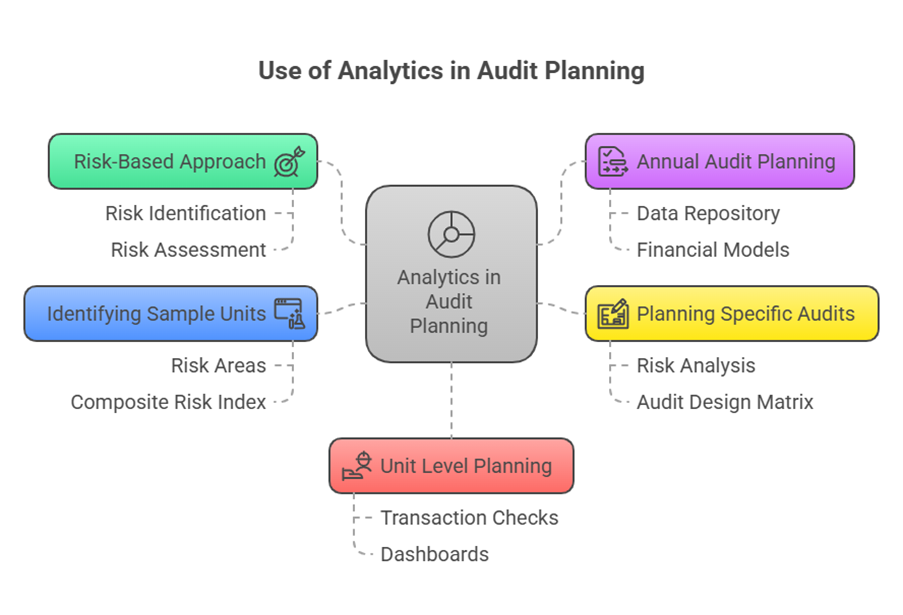
Use in Audit Planning:
- Supports the risk-based approach, aiding identification of high-risk entities/areas. Strengthens existing risk assessment practices.
- Contributes to Annual audit planning: A data repository of datasets and models can feed into the risk analysis process, providing a holistic risk assessment. Financial or sector-specific models assist this task.
- Contributes to Planning specific audits: Used for risk analysis, issue identification, setting objectives, drawing evidence-based samples for substantive checks, and unit level planning. Insights help define broad objectives and frame the Audit Design Matrix.
- Aids in Identifying sample units for substantive checks: Identifies risk areas, significant transactions, and outliers for a more scientific/focused approach. Helps arrive at a composite risk index based on weighted risk parameters for objective sample selection and determining the nature, extent, and timing of checks. Factors not identified by analytics can also be incorporated into the composite score.
- Facilitates Unit level planning: Identifies specific transactions for substantive checks within sampled units. Dashboards with drill-down/filtering can help peripatetic parties.
Use in Audit Execution:
- Evidence collection phase.
- Peripatetic audit teams receive dashboards/analytic results from planning, providing unit insights, risk patterns, comparison to similar units, and potentially lists of sample transactions. This helps identify unit-specific issues/exceptions and focus sample selection.
- Teams can apply DA knowledge on accessed electronic data, using drill-down and analyzing subordinate datasets.
Use in Audit Reporting:
- Communicate audit results to stakeholders, complying with standards.
- Results from execution can be presented for better appreciation of findings.
- Visualisation techniques can improve the quality of presenting audit findings.
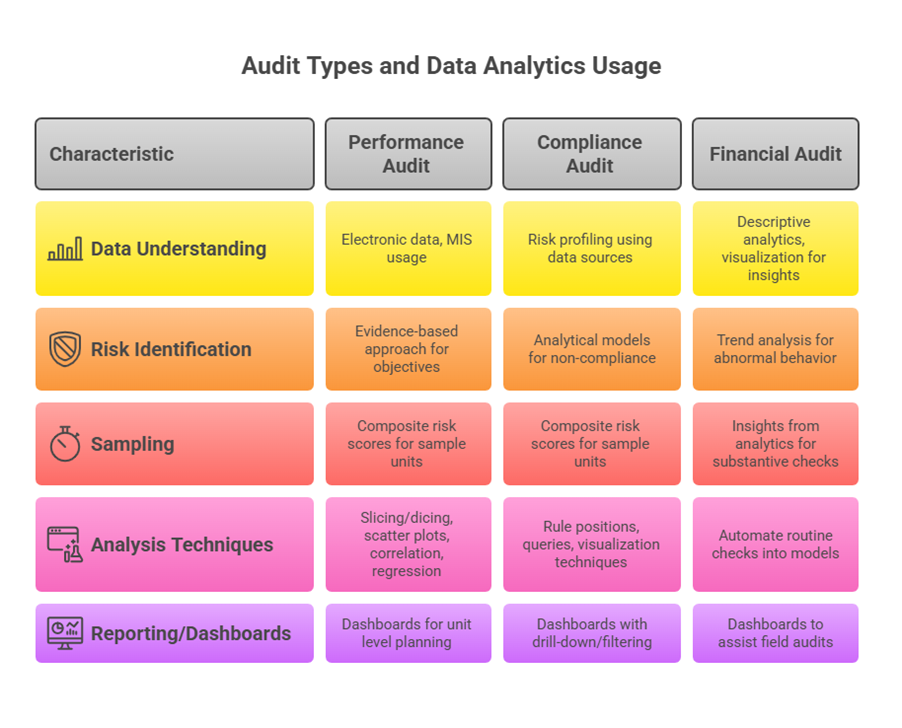
Specific applications in Performance, Compliance, and Financial audits are summarized in Annexure 4.
- Performance Audit: Understand entity/programme using electronic data, MIS, etc.. Use visual/descriptive techniques for data exploration, classification, trend analysis, geographic variations. Use GIS maps. Analyze relationships between outcomes/outputs and input factors using slicing/dicing, scatter plots, correlation, regression. Link multiple data sources. Use reliable third-party data for outcomes. Identify risks/interest areas to define objectives/sub-objectives with an evidence-based approach. Use analytics to identify sample units based on composite risk scores. Use dashboards for unit level planning. Improve reporting quality with visualization.
- Compliance Audit: Risk profiling entities to identify high-risk areas/activities using data sources. Identify non-compliance cases systematically using analytical models. Identify and rank/sort units on risk parameters (e.g., expenditure variation, delay, tax ratio). Select sample units based on composite risk scores. Identify high-risk transactions within units by incorporating rule positions through queries/dashboards to find exceptions or using visualization techniques (scatter plots, box plots) for patterns/outliers. Dashboards with drill-down/filtering can be built for sampled units. Periodic data availability allows repeating analysis for a Data Analytic Model. Performance audit analysis can be adapted.
- Financial Audit: Use descriptive analytics and visualization to understand transactions, account balances, grants, or disclosures indicating abnormality. Draw samples for substantive checks based on these insights. Automate routine checks into models updated with subsequent data. Trend analysis helps identify abnormal behaviour. Dashboards assist field audits.
Data analytics, though an evolving discipline, is being institutionalized within IA&AD to enhance the quality and efficiency of public accounting and auditing through evidence-based approaches at all stages of the audit process.