Introduction to Financial Analysis and Ratio Analysis
The basis for financial analysis, planning, and decision making is financial statements, primarily the Balance Sheet and Profit and Loss Account. While these statements depict the operating activities over a period and the financial position at a specific point, they do not always disclose all necessary and relevant information. To obtain the material information required to ascertain the financial strengths and weaknesses of an enterprise, it is necessary to analyse the data in the financial statements. Financial managers have several analytical tools for this purpose, with Ratio Analysis being one of the main ones.
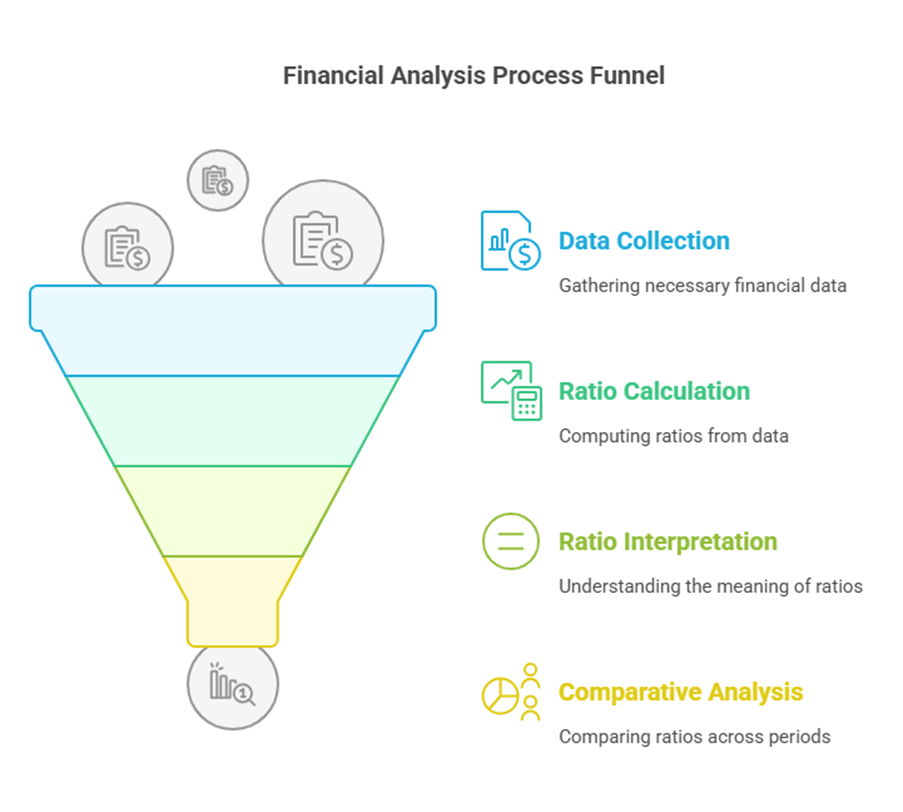
A ratio is defined as the indicated quotient of two mathematical expressions and represents the relationship between two or more things. In the context of finance, a financial or accounting ratio is a mathematical expression of the relationship between two accounting figures. Ratio analysis is the process of determining and interpreting these numerical relationships based on financial statements. It involves comparing figures not just within a single statement, but also across different statements and comparing them against previous years or industry benchmarks. A single accounting figure may not be meaningful on its own, but when expressed relative to another, it can provide significant information. Ratio analysis is considered a popular technique for analysing the performance of a business concern and is of crucial significance as a tool of financial management.
Sources of Financial Data for Analysis
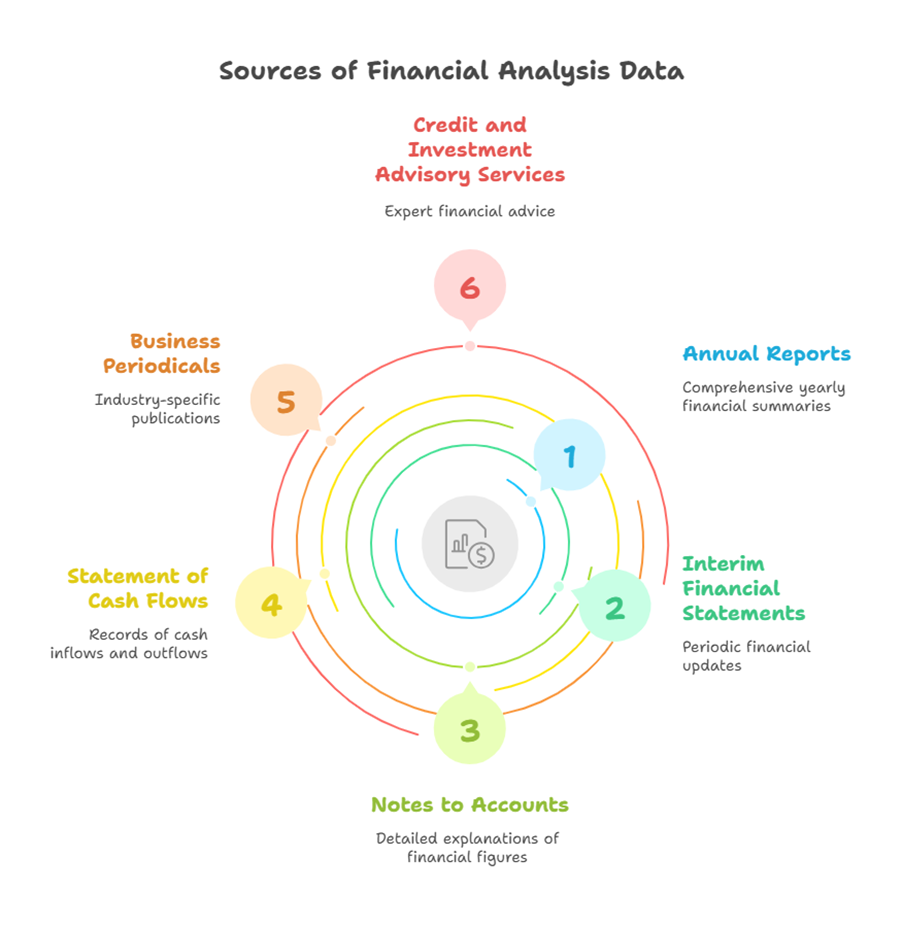
Data for financial analysis can be obtained from various sources, including:
- Annual Reports
- Interim financial statements
- Notes to Accounts
- Statement of cash flows
- Business periodicals
- Credit and investment advisory services
Types of Ratios
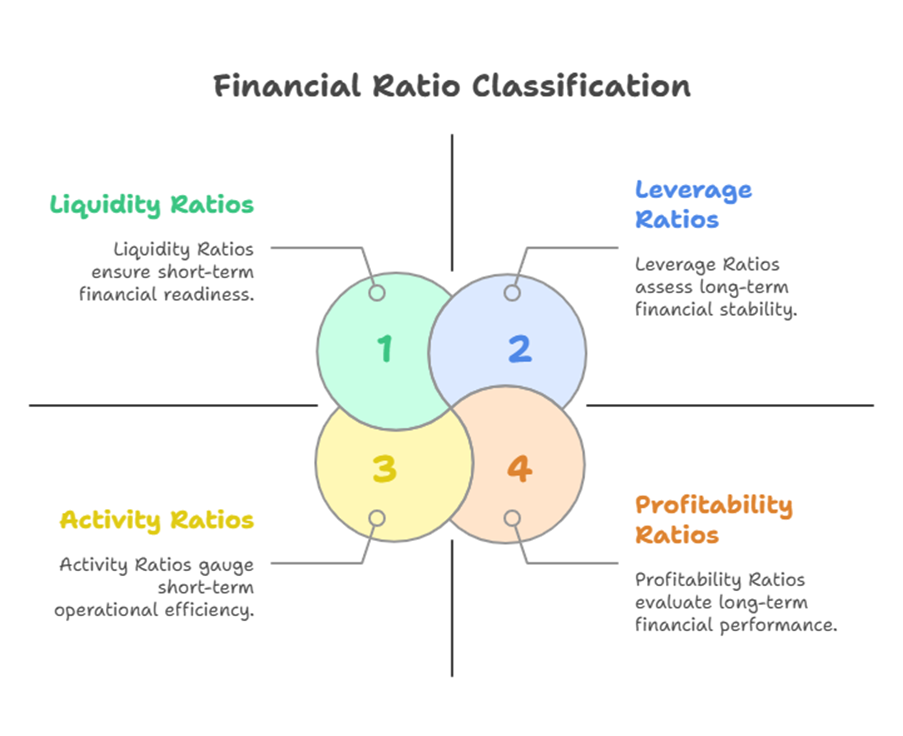
Financial ratios are classified into several types based on the aspect of the business they evaluate:
- Liquidity Ratios / Short-term Solvency Ratios: Measure the ability of the business to pay its short-term liabilities.
- Leverage Ratios / Long-term Solvency Ratios: Provide insight into financing techniques and measure the firm’s ability to service fixed liabilities. These are further classified into Capital Structure Ratios and Coverage Ratios.
- Activity Ratios / Efficiency Ratios / Performance Ratios / Turnover Ratios: Measure the efficiency with which a firm utilizes its resources.
- Profitability Ratios: Measure profitability at a given level of assets, sales, or owner’s interest. They indicate the efficiency of business operations. These can be classified based on their relation to Sales, Overall Return on Investment, Owner’s Point of View, or Market/Valuation.
Specific Ratios: Formulas and Interpretations
Let’s discuss some key ratios within each category:
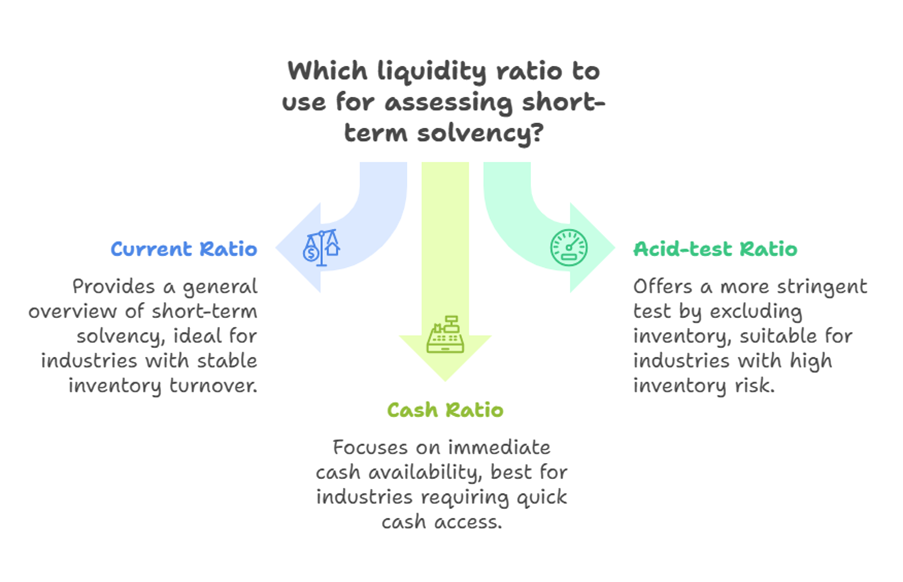
1. Liquidity Ratios These ratios assess a firm’s ability to meet its short-term obligations, i.e., those due within a year or operating cycle. Inability to pay short-term liabilities affects credibility.
- Current Ratio
- Formula: Current Assets / Current Liabilities
- Significance: Measures the short-term solvency of the firm. An ideal ratio is often considered to be 2:1, meaning current assets are twice current liabilities, providing a margin of safety. However, the ideal ratio varies by industry.
- Acid-test Ratio (Quick Ratio)
- Formula: Quick Assets / Current Liabilities
- Quick Assets are generally defined as Current Assets excluding Inventory.
- Significance: Measures a firm’s ability to meet its short-term obligations using assets that can be quickly converted to cash (quick assets). It provides a more stringent test of liquidity than the current ratio, as inventory is often the least liquid current asset.
- Formula: Quick Assets / Current Liabilities
- Cash Ratio
- Formula: (Cash + Bank + Current Investments) / Current Liabilities
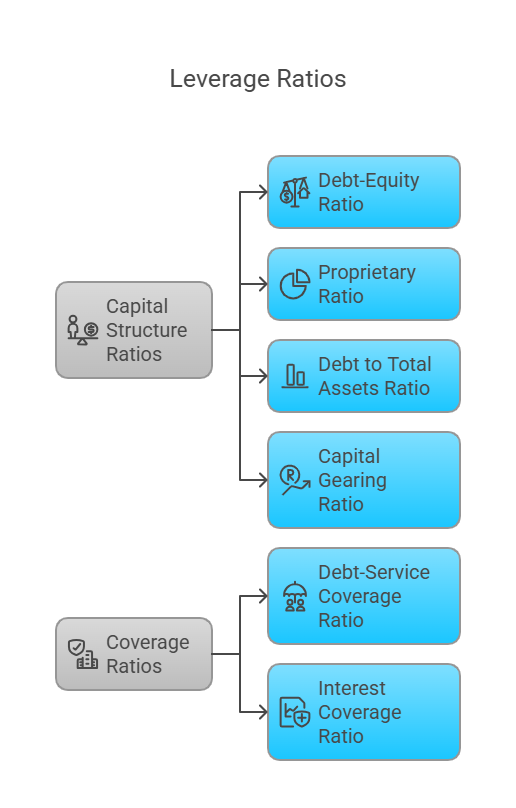
2. Leverage Ratios (Long-term Solvency Ratios) These ratios indicate the extent to which a firm uses debt financing and its ability to meet its long-term obligations.
- Capital Structure Ratios
- Debt-Equity Ratio
- Formula: Total Long-term Debt / Shareholders’ Funds. Alternatively, Total Debt / Shareholders’ Funds. Sometimes only interest-bearing, long-term debt is used instead of total liabilities (exclusive of current liabilities).
- Significance: Indicates the proportion of debt funding relative to equity. A high ratio means less protection for creditors, while a low ratio indicates a wider safety cushion, suggesting owners’ funds can absorb potential losses. The ratio is often used for capital structure decisions.
- Interpretation: Considered ideal if shareholders’ funds equal total long-term debt, or if total long-term debt does not exceed twice shareholders’ funds.
- Proprietary Ratio
- Formula: Proprietary Fund / Total Assets
- Proprietary fund includes Equity Share Capital, Preference Share Capital, and Reserve & Surplus. Total assets exclude fictitious assets and losses.
- Significance: Indicates the proportion of total assets financed by shareholders. A higher ratio generally suggests a less risky scenario.
- Formula: Proprietary Fund / Total Assets
- Debt to Total Assets Ratio
- Formula: Total Debt / Total Assets
- Significance: Measures the extent to which total assets are financed by debt.
- Capital Gearing Ratio
- Formula: (Preference Share Capital + Debentures + Other Borrowed funds) / (Equity Share Capital + Reserves & Surplus – Losses)
- Significance: Shows the proportion of fixed interest-bearing capital (like preference shares and debentures) to equity shareholders’ funds. It also signifies the potential advantage of financial leverage to equity shareholders.
- Debt-Equity Ratio
- Coverage Ratios These ratios measure the firm’s ability to meet interest payments and other fixed charges.
- Debt-Service Coverage Ratio (DSCR)
- Formula: Earnings available for debt services / (Interest + Instalments)
- Significance: Measures the ability to meet the commitment of various debt services like interest and principal repayments. Source also states it indicates liquidity in relation to meeting projected daily expenditure from operations.
- Interest Coverage Ratio
- Formula: PBIT (Profit Before Interest and Taxes) / Interest
- Significance: Measures the ability of the firm to cover its interest obligations. A higher ratio indicates greater ability to meet interest payments.
- Debt-Service Coverage Ratio (DSCR)
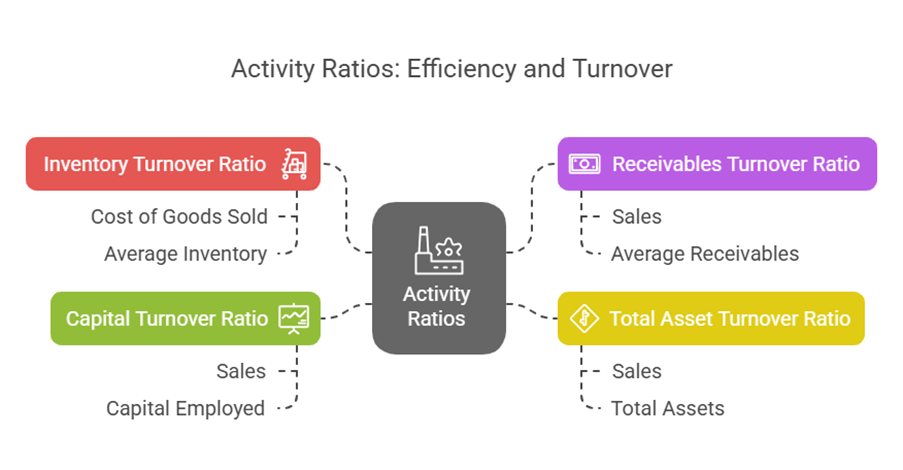
3. Activity Ratios (Efficiency Ratios / Turnover Ratios) These ratios evaluate how efficiently a company uses its assets to generate sales or revenue.
- Inventory/Stock Turnover Ratio
- Formula: Cost of Goods Sold / Average Inventory
- Average Inventory = (Opening Stock + Closing Stock) / 2
- Significance: Measures the efficiency with which a firm utilizes or manages its inventory. A higher turnover generally indicates efficient inventory management, while a low turnover might suggest slow-moving or excess stock.
- Formula: Cost of Goods Sold / Average Inventory
- Receivables Turnover Ratio (Debtors Turnover Ratio)
- Formula: Sales / Average Receivables
- Average Receivables = (Opening Receivables + Closing Receivables) / 2
- Significance: Measures how efficiently a firm collects its receivables. A higher turnover indicates faster collection.
- Formula: Sales / Average Receivables
- Total Asset Turnover Ratio
- Formula: Sales / Total Assets
- Significance: Measures the efficiency with which a firm uses its total assets to generate sales.
- Capital Turnover Ratio
- Formula: Sales / Capital Employed
- Significance: Measures the efficiency of capital employed in generating sales.
4. Profitability Ratios These ratios measure the profitability of the firm, assessing its ability to generate profits relative to sales, assets, or equity.
- Profitability Ratios based on Sales
- Gross Profit Ratio (Gross Profit Margin)
- Formula: (Gross Profit / Sales) × 100
- Significance: Measures the percentage of each sales rupee remaining after accounting for the cost of goods sold. It indicates the margin available to cover operating expenses and generate net profit. A high ratio is a favourable sign.
- Net Profit Ratio
- Formula: (Net Profit / Sales) × 100
- Significance: Measures the percentage of each sales rupee remaining after all expenses, including taxes and interest, are deducted.
- Operating Profit Ratio
- Formula: (Operating Profit / Sales) × 100 or (Earnings before Interest and Taxes (EBIT) / Net Sales) × 100.
- Significance: Measures the profitability of the firm’s core operations. It excludes interest and taxes.
- Gross Profit Ratio (Gross Profit Margin)
- Profitability Ratios related to Overall Return on Assets/Investments
- Return on Investment (ROI) / Return on Capital Employed (ROCE)
- Formula: (EBIT (1-t) / Capital Employed) × 100. Note: Capital Employed includes investments made by shareholders and debtholders.
- Significance: Indicates the earnings available to equity shareholders in comparison to equity shareholders’ net worth (This specific interpretation in seems to apply more to ROE based on the formula provided there; typically, ROCE measures return on the total capital used). Source states it indicates the percentage return on total capital employed.
- Return on Assets (ROA)
- Formula: (Net Profit / Total Assets) × 100
- Significance: Measures how efficiently a company uses its assets to generate profit.
- Return on Equity (ROE)
- Formula: (Net Profit after taxes – Preference dividend (if any) / Net Worth / Equity Shareholders’ Funds) × 100
- Significance: One of the most important indicators of a firm’s profitability and potential growth from the shareholders’ perspective. It measures the return generated on the shareholders’ investment.
- Return on Investment (ROI) / Return on Capital Employed (ROCE)
- Profitability Ratios Required for Analysis from Owner’s Point of View
- Earnings per Share (EPS)
- Formula: Net profit available to equity shareholders / Number of equity shares outstanding
- Net profit available to equity shareholders can be taken as Profit After Taxes (PAT) in the absence of preference dividends.
- Significance: Indicates the portion of a company’s profit allocated to each outstanding share of common stock. It is a key metric for assessing a company’s profitability from the perspective of equity shareholders.
- Formula: Net profit available to equity shareholders / Number of equity shares outstanding
- Dividend Pay-out Ratio
- Formula: Annual cash dividends / Annual earnings or Dividends per share / Earnings per share
- Significance: Indicates the proportion of earnings per share that is distributed to shareholders as dividends.
- Earnings per Share (EPS)
- Profitability Ratios related to Market/Valuation/Investors
- Price Earnings (P/E) Ratio
- Formula: Market price per share / Earnings per share
- Significance: Shows how much investors are willing to pay for each dollar of earnings. A higher P/E ratio can indicate that investors expect higher future growth.
- Market Value / Book Value per Share (MV/BV)
- Formula: Market Value Per Share / Book Value Per Share
- Significance: Compares the market valuation of a company’s shares to their book value. A ratio greater than one indicates the market values the company higher than its book value of equity.
- Tobin’s q
- Formula: Market Value of Assets / Replacement Costs of Assets
- Significance: Measures the relationship between the market value of a firm’s assets (or equity and debt) and their replacement costs. Source also relates it to the relationship between market value and book value per equity share.
- Price Earnings (P/E) Ratio

Other Ratios and Concepts
- Du Pont Analysis: This technique decomposes Return on Equity (ROE) into several components to provide a more detailed understanding of what drives profitability. The formula is ROE = Net Profit Margin × Asset Turnover × Equity Multiplier.
- Net Profit Margin = Net Income / Revenue
- Asset Turnover = Revenue / Assets
- Equity Multiplier = Assets / Shareholders’ Equity
- Vertical Analysis: Analysis of a financial statement for a single year. Every item is expressed as a percentage of a base figure (e.g., every item in the Profit and Loss account as a percentage of gross sales, and every item on a balance sheet as a percentage of total assets). This analysis is useful for inter-firm comparison.
- Horizontal Analysis (Trend Analysis): Comparison of financial statements over several years.
- Industry-Specific Ratios: Certain ratios are particularly relevant to specific industries, such as Room Occupancy ratio for Hotels, Loans to Deposits ratios for Banks, Passenger-kilometre for Transport, and Average duration of outgoing calls for Telecom.
- Mandatory Disclosure: Companies may be required to disclose certain ratios in the notes to accounts when preparing financial statements, including Current Ratio, Debt-Equity Ratio, Debt Service Coverage Ratio, Return on Equity Ratio, Inventory turnover ratio, Trade Receivables turnover ratio, Trade payables turnover ratio, Net capital turnover ratio, Net profit ratio, Return on Capital employed, and Return on investment.
Users and Objectives of Financial Analysis
Different parties are interested in analysing financial statements for various reasons:
- Owners or Investors: Primarily interested in assessing the earning capacity of the enterprise. They use ratios like EPS, P/E ratio, ROE, and MV/BV to evaluate profitability, potential growth, and return on their investment.
- Creditors (Trade and Financial): Concerned with the firm’s liquidity and its ability to repay debt, both short-term and long-term, including interest payments. They use ratios like Current Ratio, Quick Ratio, Debt-Equity Ratio, Interest Coverage Ratio, and DSCR.
- Financial Executives (Management): Use ratio analysis as an internal tool for planning, control, and decision making. They are interested in measuring costs, efficiency, liquidity, and profitability to make intelligent operational and strategic decisions.
- Suppliers: Similar to creditors, they are interested in the firm’s short-term solvency to ensure they will be paid for goods or services supplied.
The overall objective of financial analysis is to obtain material and relevant information to ascertain the financial strengths and weaknesses of an enterprise. This includes evaluating performance, profitability, liquidity, solvency, and efficiency.
Application of Ratio Analysis in Financial Decision Making
Ratio analysis is a significant tool in financial decision making. It presents facts in a comparative manner, facilitating analysis. It is useful for assessing a firm’s performance across various aspects. Financial ratios are used for evaluating performance and can aid in making decisions related to financing (e.g., capital structure with Debt-Equity ratio), investment (e.g., profitability ratios), and managing working capital (e.g., liquidity and activity ratios).
Limitations of Ratio Analysis
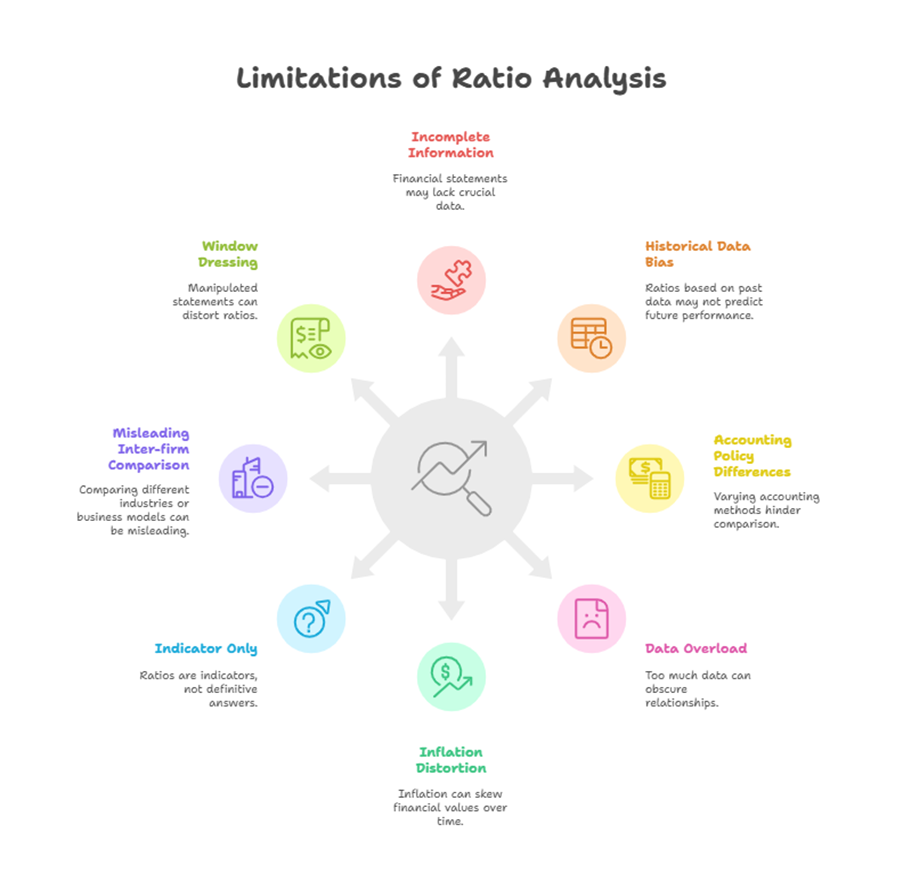
While powerful, ratio analysis has limitations:
- Financial statements may not contain all necessary and relevant information.
- Ratios are based on historical data, which may not be indicative of future performance.
- Different accounting policies (e.g., inventory valuation, depreciation methods) can make comparisons between companies difficult.
- The use of ratios can lead to a large amount of data that may obscure rather than clarify relationships if not interpreted carefully.
- Inflation can distort the values presented in financial statements, affecting ratios over time.
- Ratios provide only indicators; they do not provide definitive answers. Further investigation is often required.
- Inter-firm comparison can be misleading if companies operate in different industries or have different business models or sizes.
- Window dressing (manipulating financial statements to present a better picture) can distort ratios.
Effective ratio analysis requires experience and a clear objective to select and interpret the most meaningful ratios in a given situation.