Introduction to Financial Analysis
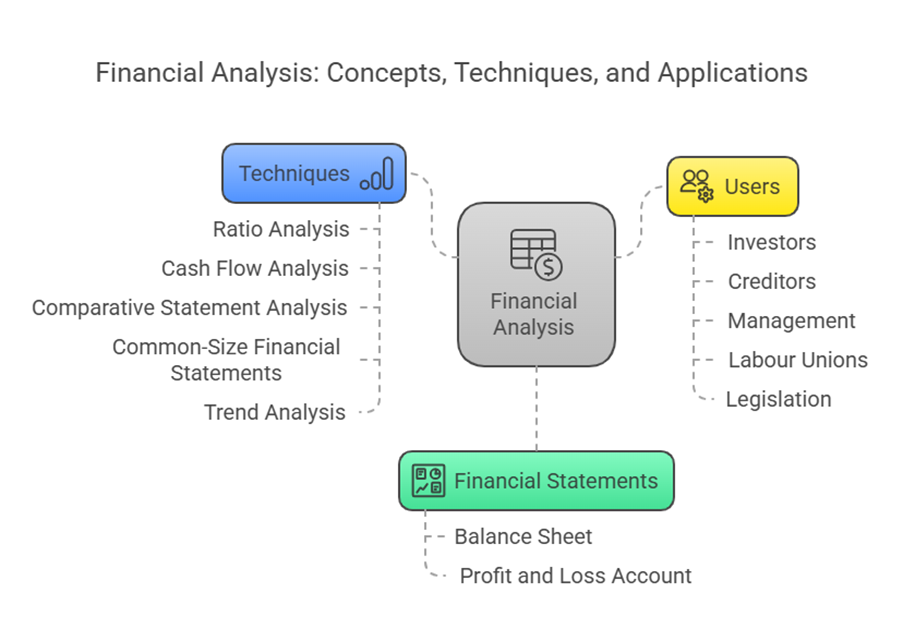
Financial analysis is a crucial process in financial management, concerned with evaluating the relationship between component parts of financial statements to obtain a better understanding of a firm’s position and performance. The basis for financial analysis, planning, and decision making is financial statements, primarily the Balance Sheet and Profit and Loss Account. The Profit & Loss Account shows the operating activities over a period, while the Balance Sheet depicts the value of acquired assets and liabilities, representing the financial position at a specific point in time. Financial analysis involves arranging financial data, classifying it methodically, and regrouping it into distinct components. It requires applying analytical tools to the financial data of a firm. It is considered an art, involving processes like arrangement, analysis, establishing relationships between facts, and drawing conclusions. In the modern phase of financial management, financial analysis has greatly increased in scope and is important for decision making.
Financial analysis can be approached in different ways. A broad approach provides a conceptual and analytical framework for financial decision making and is considered an integral part of overall management. Historically, financial statement analysis was sometimes viewed as a separate branch, based on a basic conceptual framework not applicable in internal decision making. However, the modern approach connects financial statement analysis closely with economic and finance models. While traditional analysis used simple mathematical tools like ratios, percentages, and averages based on conventional accounting data, the modern approach utilizes various statistical tools, complicated mathematical models, and considers reported and unreported accounting data, as well as non-accounting data like share prices,.
Financial analysis serves various users for different objectives. Investors analyze financial policies and investment patterns. Creditors assess creditworthiness and the ability to meet obligations. Management uses it for planning, decision-making, and control. Labour unions can understand income and expenditure to bargain for wages and benefits. Legislation may use the information for regulations like licensing and price fixing.
Techniques of Financial Analysis
Several analytical tools and techniques are used in financial analysis and planning. The main tools mentioned include Ratio Analysis and Cash Flow Analysis,. Other tools include Comparative Statement Analysis, Common-Size Financial Statements, and Trend Analysis,.
- Ratio Analysis: Ratio analysis is the process of determining and interpreting numerical relationships based on financial statements. A ratio is a statistical yardstick measuring the relationship between variables or figures, which can be expressed as a percent or a quotient. A single accounting figure alone may not convey meaningful information, but when expressed relative to another figure as a ratio, it can provide significant information. It is not just comparing numbers from different financial statements, but comparing them against previous years, other companies, or industry benchmarks,.
- Types and Classification of Ratios: Ratios are classified based on the purpose they serve. Common classifications include,,,:
- Liquidity Ratios / Short-term Solvency Ratios: These measure a firm’s ability to meet its short-term obligations. Examples include Current Ratio, Quick Ratio (Liquidity Ratio), Super-quick Ratio, and Defensive Interval Ratio. The Current Ratio is one that companies are now required to disclose in their financial statements. It indicates the relationship between current assets and current liabilities. Short-term solvency ratios assess a firm’s ability to meet expected and unexpected cash requirements, expand assets, reduce liabilities, and cover contingent liabilities. Liquidity analysis is crucial as lack of liquidity can lead to business failure.
- Leverage Ratios / Long-term Solvency Ratios: These examine the relationship between owner’s funds and loan funds to assess the firm’s ability to meet long-term obligations and the security of long-term creditors. The Debt-Equity Ratio is a key example, now required for disclosure,. It ascertains the proportion of outsiders’ funds (total long-term debt) to shareholders’ funds. Long-term solvency ratios include Fixed Assets Ratio and Proprietary Ratio. These ratios provide insight into the capital structure and the extent to which debt is used,. Leverage analysis specifically deals with how debt impacts potential returns and risk,,,.
- Activity Ratios / Efficiency Ratios / Performance Ratios / Turnover Ratios: These measure how efficiently the firm is utilizing its assets or resources,. Examples include Inventory turnover ratio, Trade Receivables turnover ratio (Debtors Turnover Ratio), Trade Payables turnover ratio, and Net Capital Turnover Ratio. These ratios relate activity (like sales) to specific asset categories.
- Profitability Ratios: These measure the operating efficiency and profitability of the firm,. Examples include Net Profit Ratio, Return on Capital Employed, and Return on Investment. There are also profitability ratios related to market/valuation/investors, such as Return on Equity Ratio. These ratios are critical for evaluating the success of the business.
- Application and Use of Ratios: Ratios are used to analyse financial statements from various perspectives, including investors, lenders, suppliers, and managers,. They help evaluate profitability and the financial position of an entity. Ratios provide clues for financial analysis. Financial managers use a large number of ratios to analyse the financial status and activities of the firm, measuring its liquidity, determining profitability, and assessing overall financial performance,. Ratio analysis is applied in financial decision making. Ratios can be used for evaluating company performance on aspects like operating efficiency and liquidity. They are important for both inter-firm (comparing one company to another) and intra-firm (comparing a company’s performance over time) comparisons,.
- Financial Scores: Some analytical tools combine multiple ratios or data points into a single score to assess a company’s financial health or potential manipulation. Examples include Altman’s Z Score, Beneish M Score, and Piotroski F Score,,. The Piotroski F-score is a scoring system from 0 to 9 based on nine variables covering profitability, leverage/liquidity, and operating efficiency; a higher score suggests stronger financial performance.
- Types and Classification of Ratios: Ratios are classified based on the purpose they serve. Common classifications include,,,:
- Funds Flow Analysis: Funds Flow Analysis is another important analytical tool,,. In a popular sense, the term “funds” refers to Working Capital, which is the excess of Current Assets over Current Liabilities. A Funds Flow Statement gives a detailed analysis of changes in the distribution of resources between two Balance Sheet dates. It provides insights into how funds (working capital) moved into and out of the business during a period. Key aspects include identifying the sources and uses (application) of funds,. One major use is to determine if short-term funds are being used to finance long-term investments, a practice that increases the risk of a liquidity crunch, credit risk, and default risk because long-term investments may not generate sufficient surplus in time to meet short-term liabilities. The analysis involves preparing a Statement or Schedule of Changes in Working Capital and a Statement of Funds Flow. Significance of Funds Flow Analysis includes helping bankers, creditors, and financial institutions assess the degree of risk involved in granting credit. It also reveals the net results of operations during the year in terms of cash (though this description might lean towards cash flow analysis).
- Cash Flow Analysis: Cash Flow Analysis is also highlighted as a main analytical tool,,. A Cash Flow Statement explains how cash and cash equivalents held by the business changed between two balance sheet dates. Cash equivalents are defined as short-term, highly liquid investments that are readily convertible into cash. Cash flows are typically presented grouped into three main activities: Operating, Investing, and Financing,. Operating activities relate to the primary revenue-generating activities; Investing activities involve the acquisition and disposal of long-term assets and other investments; Financing activities involve changes in the size and composition of equity capital and borrowings. Cash Flow Analysis is a useful tool for analyzing the efficiency of funds utilization. It is a critical part of financial planning and decision-making in a business firm. It provides information on the cash receipts and payments of an entity during a period. A Cash Flow Statement reveals the causes of changes in the cash position of a business between two balance sheet dates. There is a distinction between Fund Flow Statements and Cash Flow Statements,.
- Other Analytical Aspects and Applications:
- Leverage Analysis: While often discussed under Financing Decisions, Leverage Analysis (Operating, Financial, Combined) is a type of analysis that helps understand the impact of cost structure and capital structure on profitability and risk,,. Financial leverage specifically examines the risk associated with the amount of debt in the capital structure,.
- Capital Budgeting: This is the long-term investment decision, a key function of financial management,. It involves evaluating proposed long-term investments,, forecasting returns, and comparing profitability to the cost of capital,. Techniques like NPV, IRR, PI, Payback, and ARR are used in capital budgeting to appraise investment proposals,,,. Capital budgeting requires analyzing risk and uncertainty,. While a decision area, it heavily relies on techniques like calculating cash flows and using discount rates which stem from broader financial analysis concepts.
- Financial Planning: Financial analysis is integral to financial planning,,. It provides insights needed to forecast capital requirements, manage working capital, and make decisions on capital structure.

Limitations of Financial Analysis
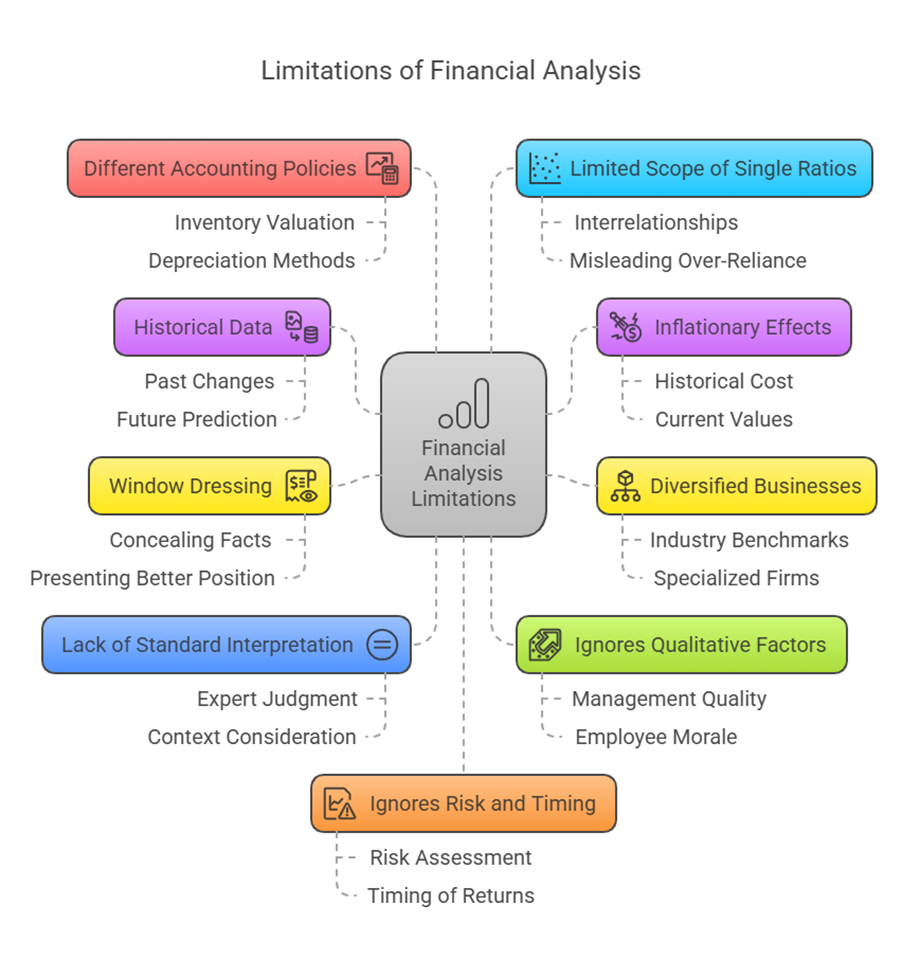
Despite its importance, financial analysis, and particularly the use of ratios, is subject to several limitations,,,.
- Historical Data: Financial analysis is often based on historical financial statements,. For example, Funds Flow Statements are historical in nature and indicate only past changes,. While useful, historical data may not be a perfect predictor of future performance or position.
- Inflationary Effects: Financial data can be significantly distorted by inflation,. Historical cost values of assets may differ substantially from their true current values or replacement costs, making comparisons over time or across companies with assets acquired at different times difficult.
- Diversified Businesses: Many businesses operate in diverse industries or have a large number of divisions,. In such cases, ratios calculated based on aggregate company-wide data may not be suitable or meaningful for comparing the company to specialized firms or industry benchmarks.
- Window Dressing and Manipulation: Financial statements can be subject to “window dressing” or “creative accounting,” which involves manipulating accounts to conceal vital facts and present a financial position better than reality,. This distortion makes analysis based on such statements unreliable.
- Lack of Standard Interpretation: Financial ratios provide “clues but not conclusions”,. There is no single, standard, ready-made interpretation for financial ratios. Analysis requires expert judgment and consideration of the specific context of the company and industry,.
- Ignores Qualitative Factors: Financial analysis primarily deals with quantitative data. It may not adequately capture important qualitative factors that affect a business’s performance or position, such as management quality, employee morale, industry trends, or technological changes.
- Different Accounting Policies: Companies may use different accounting policies (e.g., inventory valuation methods, depreciation methods),. These differences can distort comparability even between similar firms. A uniform system of accounts and standard formats can help overcome this for inter-firm comparisons, but variations persist.
- Limited Scope of Single Ratios: A single ratio provides only a partial view. Analysis requires looking at a group of ratios together and understanding their interrelationships,. Over-reliance on a single ratio can be misleading.
- Ignores Risk and Timing: Simple profitability ratios or analyses focused solely on profits may ignore important factors like risk or uncertainty and the timing of returns. A higher return might come with significantly higher risk, which a simple ratio might not highlight. Wealth maximization, in contrast, considers both the timing and risk of expected returns through methods like discounting expected cash flows.
- Limitations Specific to Funds Flow Analysis: Funds flow analysis primarily focuses on changes in working capital. It indicates past changes but cannot reveal continuous changes. Transactions where both aspects are current or both are non-current may not be included,. Some opinions suggest it is not the ideal tool for financial analysis.
- Limitations Specific to Cash Flow Analysis: Like funds flow analysis, cash flow analysis also has limitations.
In summary, financial analysis provides powerful techniques like ratio analysis, funds flow analysis, and cash flow analysis to evaluate a company’s performance and position,,. However, analysts must be aware of the inherent limitations, such as the use of historical data, the impact of inflation and accounting choices, potential manipulation, the need for expert judgment, and the fact that these tools provide insights rather than definitive conclusions,,.